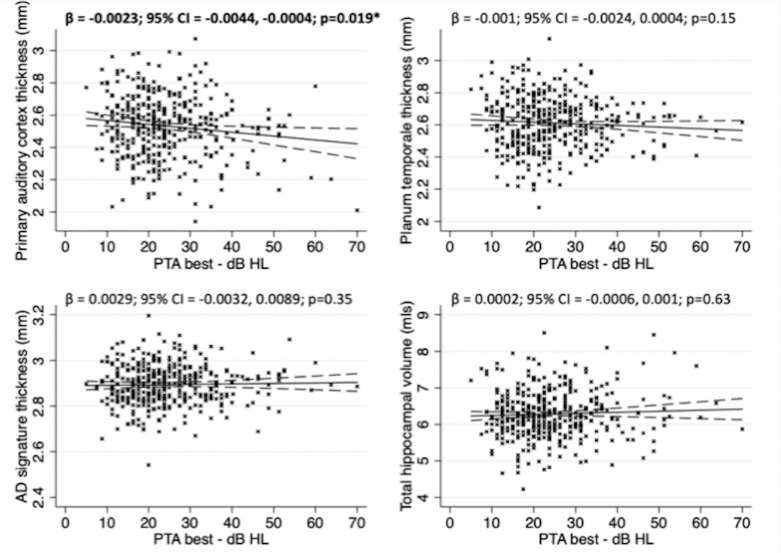
Figure 1.
Association between pure tone audiometry performance and grey matter structural metrics in cognitively normal older adults following multivariate linear regression with robust SE. Covariates included: age at scan; sex,; APOEε4 genotype; WMHV; educational attainment; childhood cognitive ability; socioeconomic position’Aβ status; and TIV (for hippocampal volume analysis only). Solid line represents line of best of fit. Dashed lines represent 95% CIs. The crosses represent raw unadjusted data points for each individual included in the analysis. AD, Alzheimer’s disease; PTA, pure tone average in best hearing ear; TIV, total intracranial volume; WMHV, white matter hyperintensity volume.

