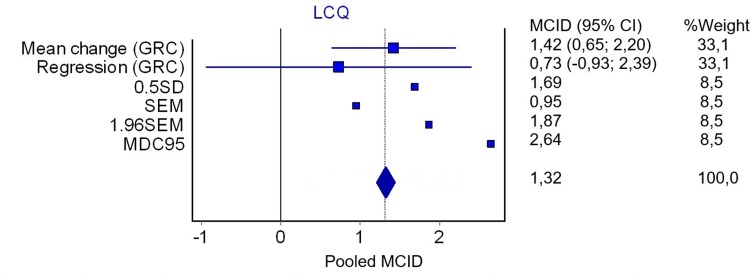
Figure 2.
Plot of the pooled MCID for the Leicester cough questionnaire. The plot represents the MCID estimates derived in this study, and where appropriate the estimates include the 95% confidence interval (n=45).
Abbreviations: LCQ, Leicester cough questionnaire; GRC, Global rating of change; SD, standard deviation; SEM, standard error measurement; MDC, minimal detectable change.

