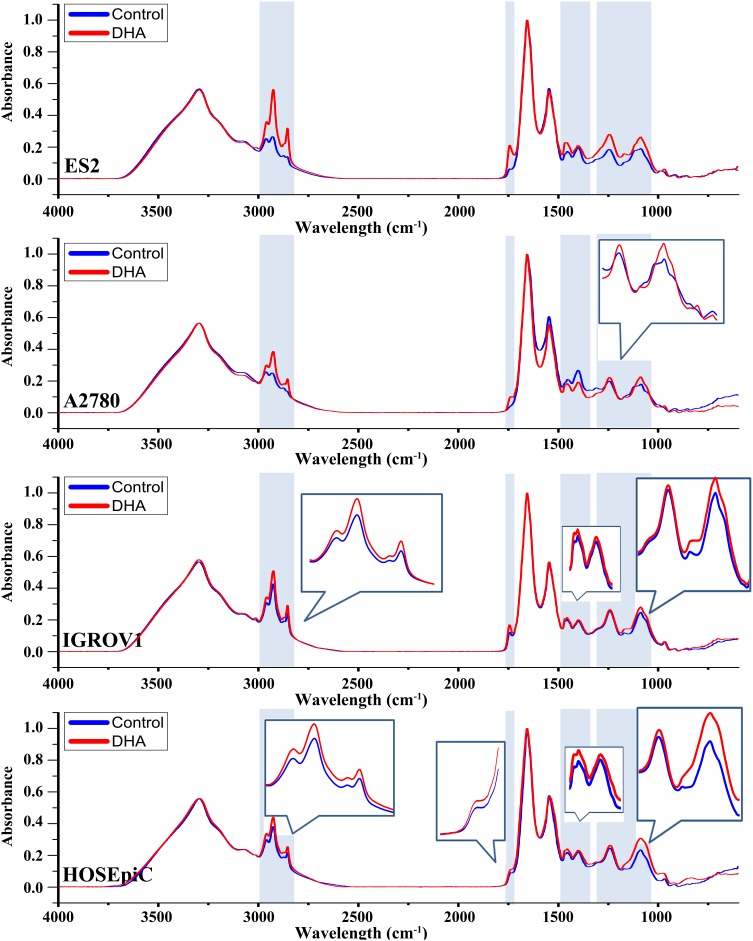
Figure 2.
FTIR spectra of ovarian cancer cells (ES2, A2780 and IGROV1) and normal cells (HOSEpiC) treated with DHA. Cells were treated with or without DHA at the concentration corresponding to their IC50 for 48 hr. Typical spectra are presented in the region of 4000–600 cm−1 (control group: blue line; DHA group: red line). There were significant differences in the FTIR spectra of cells after exposure to DHA, especially in the regions of 3000–2800 cm−1, 1800–1700 cm−1, 1500–1300 cm−1 and 1300–900 cm−1, which are indicated in the blue background. Local spectral features that were not clearly observed are magnified in boxes.

