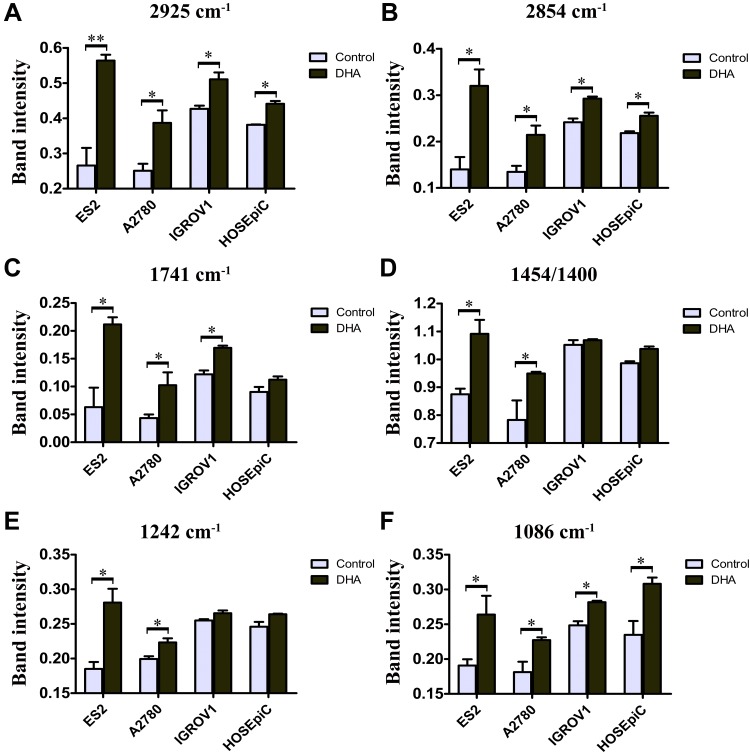
Figure 3.
Intensity of specific bands of cells treated with or without DHA. Ovarian cancer cells (ES2, A2780 and IGROV1) and normal cells (HOSEpiC) were treated with or without DHA at the concentration corresponding to their IC50 for 48 hr. Relative intensities of specific bands of 2925 cm−1 (A), 2854 cm−1 (B), 1741 cm−1 (C), 1242 cm−1 (E) and 1086 cm−1 (F) as well as the ratio of 1454/1400 (D) were calculated and compared. *P<0.05; **P<0.01.

