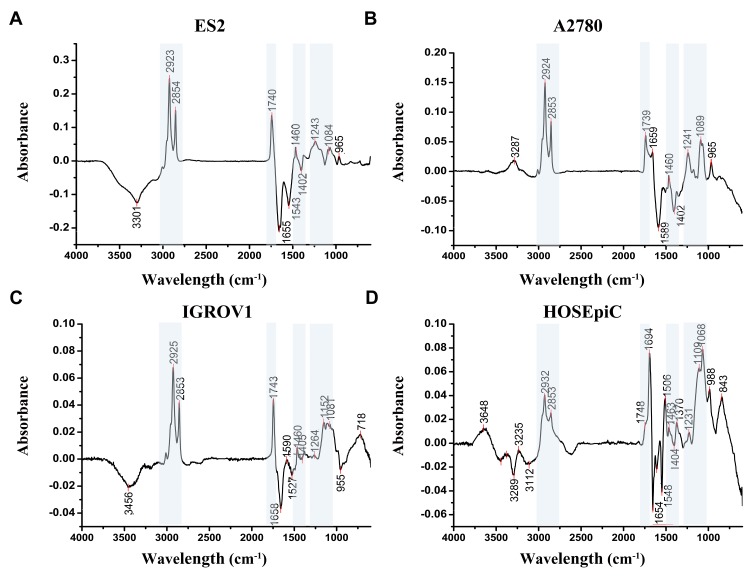
Figure 4.
Subtraction spectrum of each of the cell lines treated with DHA vs vehicle control. Dominant differences in the subtraction spectra of the cell lines ES2 (A), A2780 (B), IGROV1 (C) and HOSEpiC (D) after exposure to DHA, especially in the signals at around 2925 cm−1, 2854 cm−1, 1741 cm−1, 1460 cm−1 and 1400 cm−1 as well as 1242 cm−1 and 1086 cm−1, are indicated in the blue background.

