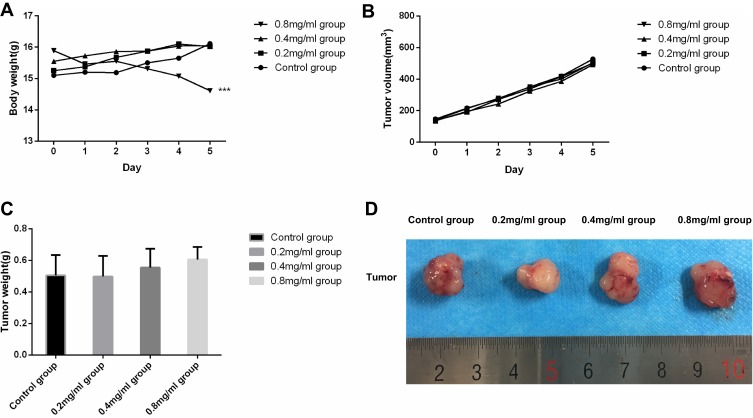
Figure 1.
(A) Weight change curve of nude mice (g) during intervention (n=8). (B) Tumor volume change curve of nude mice (g) during intervention (n=8). (C) Tumor weight of mice in the different groups on day 5 (n=8). (D) Representative tumors from mice in the different groups on day 5. ***P<0.001 versus the control group.

