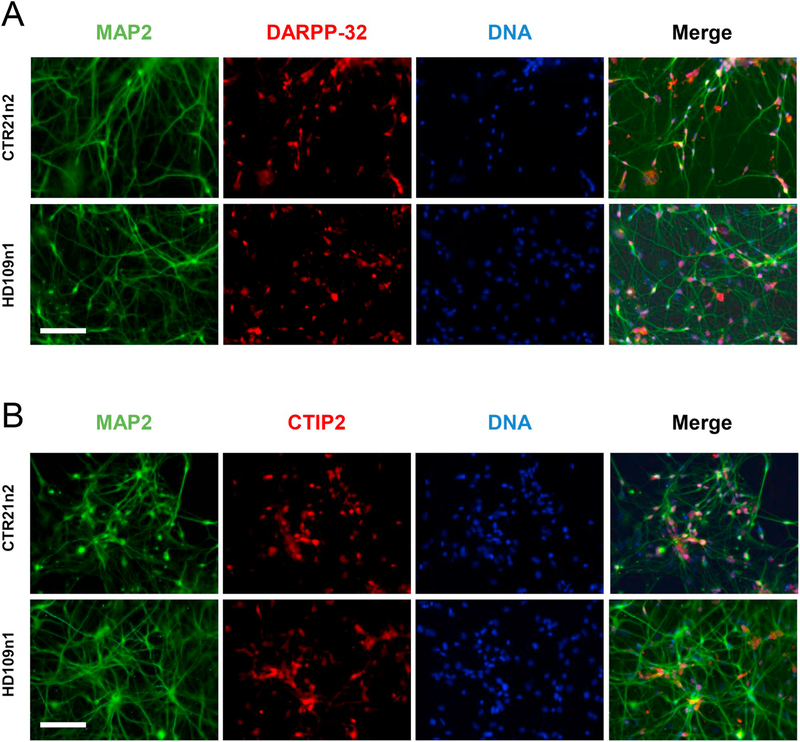
Fig. 5. Characterization of differentiated patient-derived induced pluripotent stem cells.
(A) Representative images of differentiated control (CTR21n2) and HD (HD109n1) iPSCs. Cells were stained with Hoechst to visualize nuclei and MAP2 to visualize projections and the medium spiny neuron marker DARPP-32. Scale bar: 150 μm.
(B) Representative images of differentiated control (CTR21n2) and HD (HD109n1) iPSCs. Cells were stained with Hoechst to visualize nuclei and MAP2 to visualize projections and the medium spiny neuron marker CTIP2. Scale bar: 150 μm.

