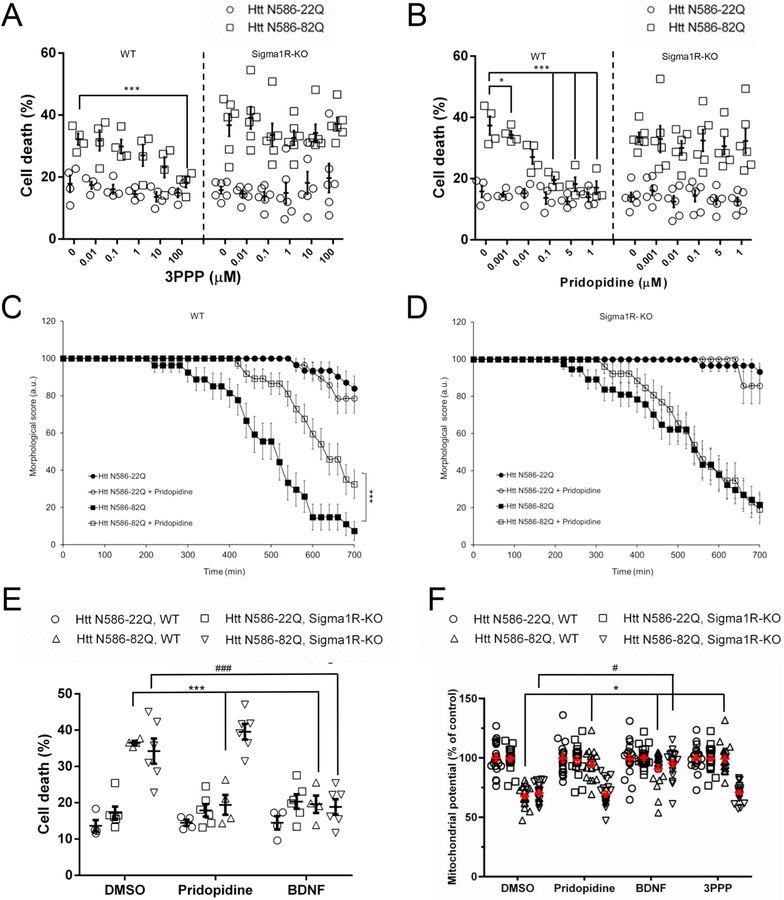
Fig. 7. Genetic knock-out of the sigma-1 receptor abolishes the protection of cortical neurons by pridopidine treatment.
(A-B) Cell death quantification of 3PPP (A) and pridopidine (B) treated sigma-1 receptor wild type and knockout cortical neurons. Sigma-1 receptor wild type (WT) and knockout (Sigma1R-KO) mouse primary cortical neurons were assayed and quantified as described. Results presented as individual values plus means ± S.E. of the percentage of dead cells. ** p < .01 vs Htt-82Q untreated cells, *** p < .001 vs Htt-82Q untreated cells, ANOVA with Bonferroni post-hoc test. (n = 4 independent WT neuronal preparations and n = 6 independent Sigma1R-KO neuronal preparations).
(C-D) Live cell imaging assay of a treatment with 1 μM pridopidine in WT (C) and Sigma1R-KO (D) cortical neurons. Transfected mouse primary cortical neurons were tracked and cell death was quantified as described. *** p < .001 vs Htt-82Q untreated cells. Survival analysis was performed using a Gehan-Breslow test to determine a statistical difference between groups, followed by an All Pairwise Multiple Comparison (Holm-Sidak method) to identify the differences between groups. (n = 70 independent cells from 3 independent neuronal preparations).
(E) Quantification of cell death in WT and Sigma1R-KO primary cortical neurons treated with 1 μM pridopidine or 20 ng/mL BDNF. Automated picture acquisition and quantification of nuclear intensity performed as described. Results presented as individual values plus means ± S.E. of the percentage of dead cells. *** p < .001 vs Htt-82Q, WT and #p < .05 vs HttN86–82Q, Sigma1R-KO. ANOVA with Bonferroni post-hoc test. (n = 4 independent WT neuronal preparations and n = 6 independent Sigma1R-KO neuronal preparations).
(F) Quantification of mitochondrial potential using TMRM staining, Average intensity of staining in the soma of transfected WT and Sigma1R-KO neurons was measured after 24 h of the indicated treatments. * p < .05 vs Htt N86-82Q, WT and # p < .05 vs Htt N86-82Q, Sigma1R-KO by ANOVA with Bonferroni post-hoc test. (n = 3 independent neuronal preparations for a total of 20 independent cells).

