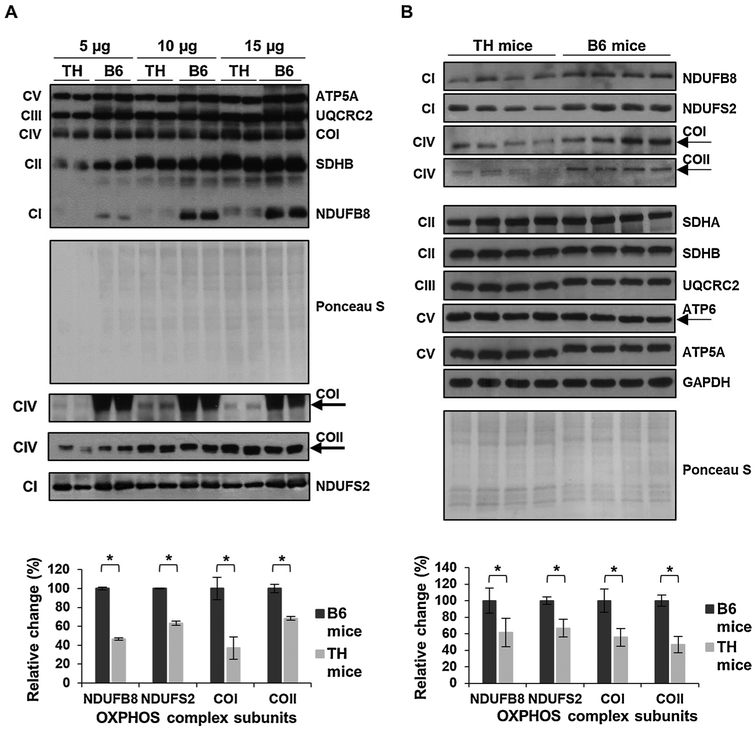
Fig. 1.
Mitochondrial OXPHOS is impaired in TH mice liver. A) To determine the linear response range of the antibodies, the expression of OXPHOS subunits NDUFB8 and NDUFS2 (complex I), SDHA and SDHB (complex II), UQCRC2 (complex III), COI and COII (complex IV), and ATP5A and ATP6 (complex V) was detected at varying protein amounts by Western blot analyses of TH and B6 mice liver lysates (n = 2 in each group). The average quantitative analyses of the protein bands (15 μg) by densitometry are shown in the bottom panel. B) The expression of OXPHOS complexes in TH and B6 mice liver (n = 4 in each group). The graph (bottom panel) represents the average quantitative analyses of the OXPHOS complex subunits with significant changes from each mouse strain at the optimal protein amount determined in A. The mitochondrial-encoded subunits COI, COII, and ATP6 are marked by arrows. Approximately 5–30 μg of protein lysate was separated by 12% SDS-PAGE and equal protein loading was evaluated by Ponceau S staining and GAPDH probing of the membranes. Results represent the mean ± SD of at least three experiments for each mouse strain and are presented as a percentage of B6 mice. Significant difference was observed between B6 and TH mice using an unpaired Student’s t-test (2-tailed), *P < 0.05.

