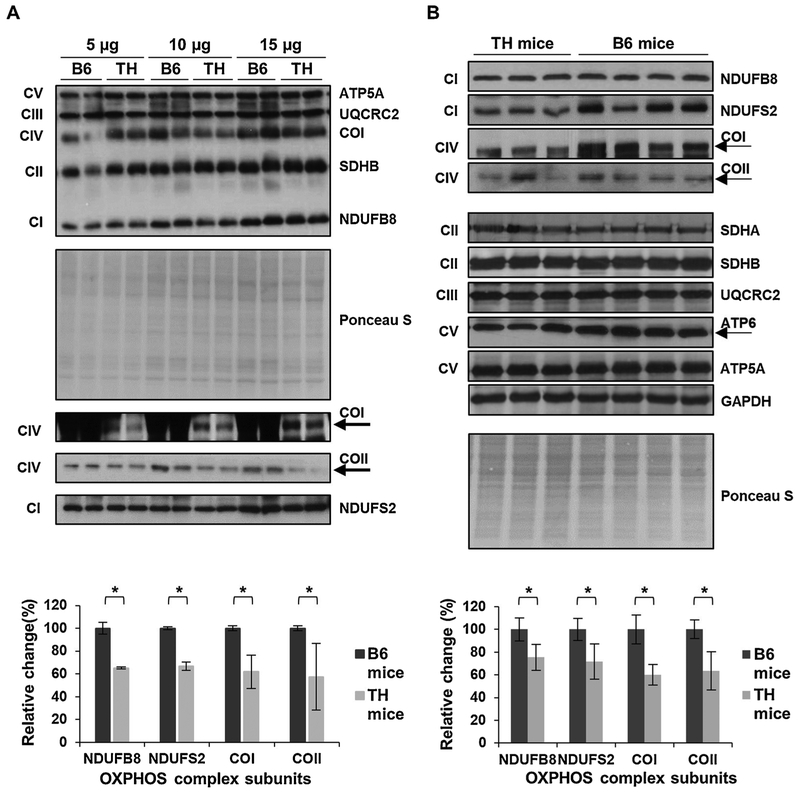
Fig. 3.
Mitochondrial OXPHOS is reduced in TH mice kidney. A) The expression of OXPHOS subunits in TH and B6 kidney tissue lysates (n = 2 in each group) was evaluated at various protein amounts by Western blot analyses and Ponceau S staining. The average quantitative analyses by densitometry of OXPHOS subunits using 15 μg total protein lysate is shown in the bottom panel. B) Western blots of the OXPHOS subunit expression in TH (n = 3) and B6 (n = 4) mice kidney lysates. The graph in the bottom panel represents the average quantitative analysis of OXPHOS subunits with significant changes at the optimal protein amount determined in A. The expression of mitochondrial-encoded subunits COI, COII, and ATP6 are marked by arrows. Results represent the mean ± SD of at least three experiments for each mouse strain and are presented as a percentage of B6 mice. Significant difference was observed between the mouse strains using unpaired Student’s t-tests 12-tailed), *P < 0.05. See Fig. 1 legend for details.

