Figure 3.

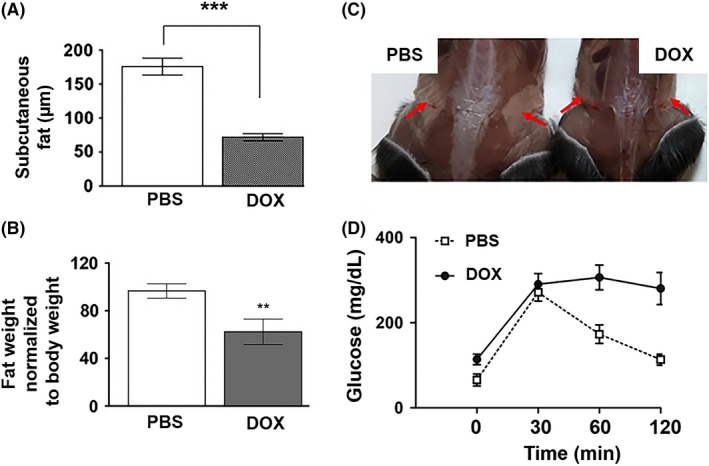
A, Quantification of the thickness of subcutaneous fat in 16‐18‐wk‐old mice treated with PBS or DOX at 2 wk of age (n = 4, ***P < .001). B, The weight of inguinal fat normalized to body weight in PBS‐ or DOX‐treated mice (n = 4, **P < .01). C, A representative photo of inguinal fat (arrows) in 17‐wk‐old PBS or DOX‐treated mice. D, Glucose tolerance test in mice injected with PBS or DOX at 2 wk of age (n = 4)
