Figure 3.

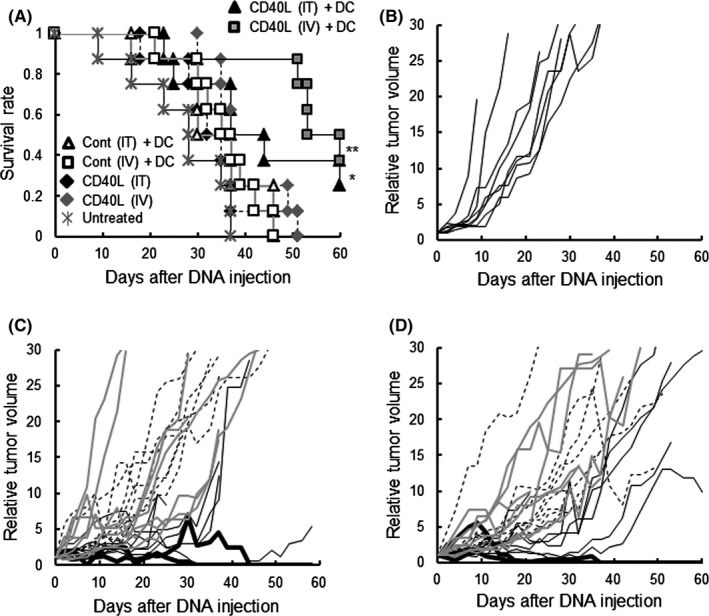
Effect of CD40L gene‐transfection on DC‐based therapy. (A) Survival of mice with the indicated treatments. (B) The relative tumor volume (with the volume on day 0 set at 1) of each mouse in the [Untreated] group. (C) The relative tumor volume of each mouse of the intratumoral (IT) gene‐administered group. Black solid lines indicate relative tumor volumes of the [CD40L (IT) +DC] group. Black dotted lines indicate relative tumor volumes of the [CD40L (IT)] group. Gray solid lines indicate relative tumor volumes of the [Cont (IT) + DC] group. (D) The relative tumor volume of each mouse in the intravenous (IV) gene‐administered group. Black solid lines indicate those of the [CD40L (IV) +DC] group. Black dotted lines indicate those of the [CD40L (IV)] group. Gray solid lines indicate those of the [Cont (IV) + DC] group. Experiments were performed independently three times, using a total of eight mice in each group. All mice were humanely euthanized according to the criteria in Section 2. *P < .05, vs the [Untreated] group. **P < .01, vs the [Untreated] and [Cont (IV) + DC] groups
