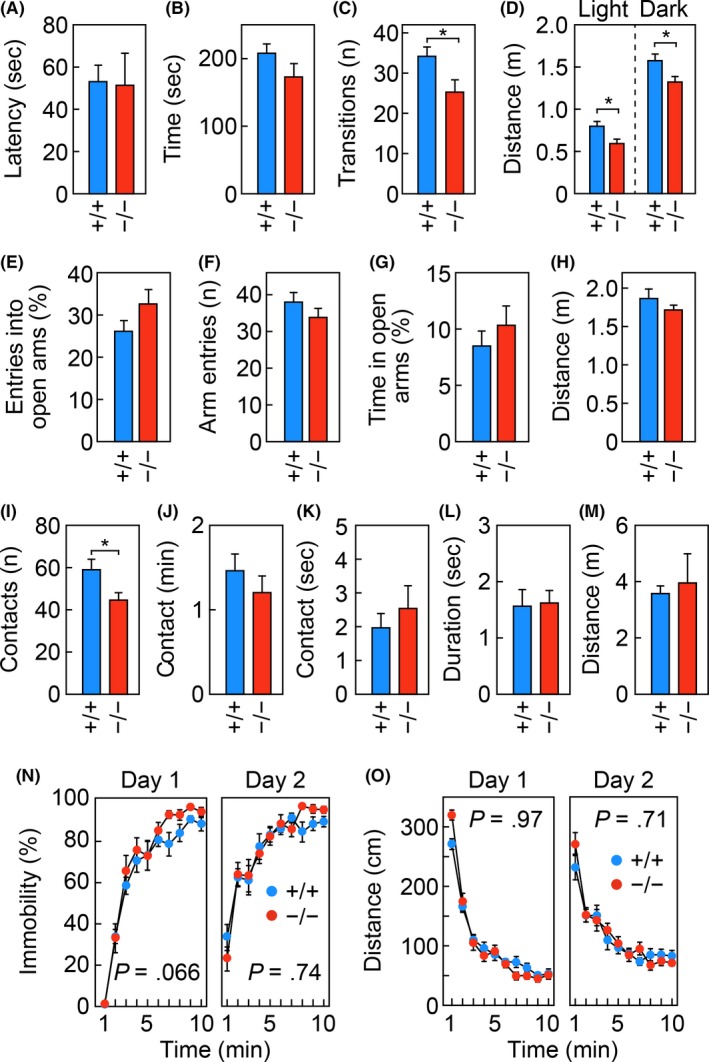
Figure 5.

Reduced activity in the light–dark transition test in Elovl1 −/− Tg(IVL‐Elovl1) mice. Elovl1 +/+ Tg(IVL‐Elovl1) (n = 12) and Elovl1 −/− Tg(IVL‐Elovl1) (n = 11) mice were subjected to the light–dark transition test (A–D), the elevated plus‐maze test (E–H), the social‐interaction test in a novel environment (I–M), and the Porsolt forced‐swim test (N, O). Light–dark transition test: latency in entering the light chamber (A), time spent in the light chamber (B), number (n) of light–dark transitions (C), and distance traveled in the light and dark chambers (D). Elevated plus‐maze test: percentage of entries into open arms (E), number (n) of arm entries (F), percentage of time spent in open arms (G), and total distance traveled (H). Social‐interaction test in a novel environment: number (n) of contacts (I), total duration of contacts (J), total duration of active contacts (K), mean duration of each contact (L), and total distance traveled (M). Porsolt forced‐swim test: percentage of time spent immobile (N) and distance traveled (O). Error bars represent SEM. Asterisks indicate significant differences based on one‐way ANOVA (*, P < .05) (A–M). P‐values correspond to the genotype effect in a two‐way repeated measures ANOVA (N, O). +/+, Elovl1 +/+ Tg(IVL‐Elovl1) mice; −/−, Elovl1 −/− Tg(IVL‐Elovl1) mice
