Figure 4.

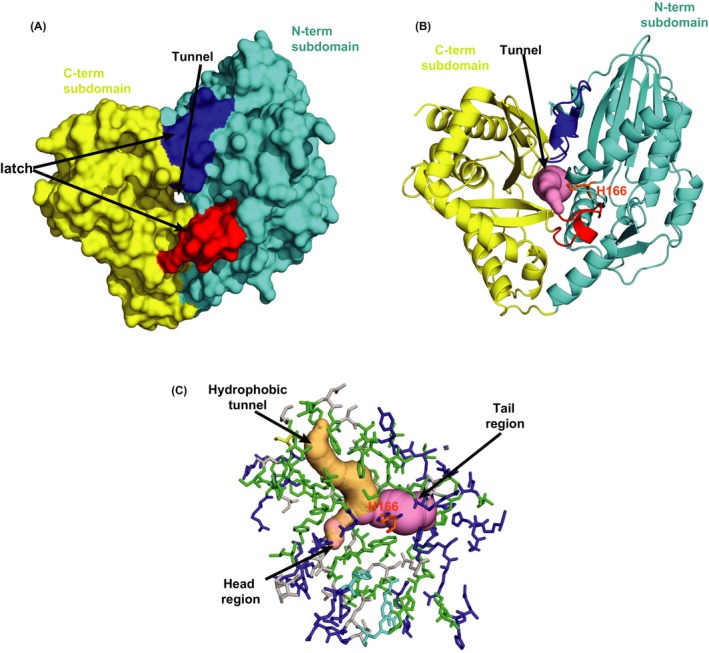
The Interface region of two subdomains harbors a tunnel for putative substrate binding. A and B, Solid surface (A) and cartoon presentation (B) of PapA2 protein structure. The tunnel (pink) is seen at the center of interface regions of two subdomains—N‐terminal subdomain (cyan) and C‐terminal subdomain (golden yellow). The two crossover points or latches are shown in red and blue. C, Stick presentation of the interface region along with pseudotunnels displaying void regions in the protein. The tunnel (pink) and hydrophobic tunnel (light orange) are marked. Residues lining the interface region are color coded based on their polarity; hydrophobic (green), charged (tv blue), and polar (gray). The active site is shown in orange
