
Figure 2.
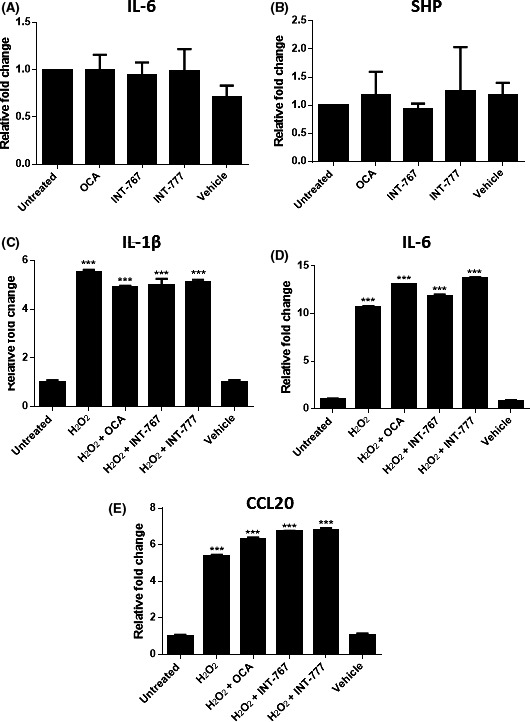
Response of the H69 cell line to FXR and TGR5 activation. A and B, Changes in IL‐6 and SHP mRNA expression in the H69 cell line following treatment with 10 μmol/L OCA, INT‐767 or INT‐777 after 24 hours. 0.001% Ethanol was used as a vehicle control. C‐E, Changes in mRNA expression of IL‐1β, IL‐6 and CCL20, respectively, following senescence induction. Significance was assessed by one‐way ANOVA relative to untreated control, *P < 0.05. Graphs are representative of three independent experiments. Error bars represent standard error