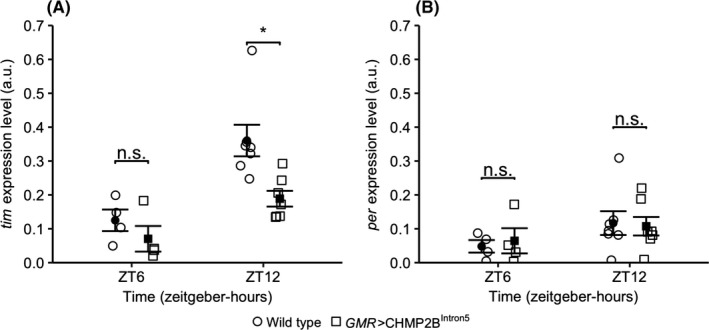
Figure 6.

Scatter plots of the normalized transcript levels of (A) tim and (B) per at ZT6 and ZT12 show that the GMR>CHMP2BIntron5 flies have a significant reduction in tim transcript levels at ZT12 when compared to wild type (Canton‐S) flies (*—P < 0.05; Welch's t test; error bars: standard error of measurement; n.s.—not significant; a.u.—normalized arbitrary unit; n = 5‐7—wild type and GMR>CHMP2BIntron5). Both wild type and GMR>CHMP2BIntron5 flies show significant increase in tim transcript levels (ZT12:ZT6 fold changetim—wild type = 2.9; GMR>CHMP2BIntron5 = 2.6 (two‐way ANOVA for time—P = 0.0003 and genotype—P = 0.003). However, the per transcript levels show a trend for increase between ZT6 and ZT12 in wild type and GMR>CHMP2BIntron5 flies (ZT12:ZT6 fold changeper—wild type = 2.3; GMR>CHMP2BIntron5 = 1.6; two‐way ANOVA for time—P = 0.11 and genotype—P = 1.0)
