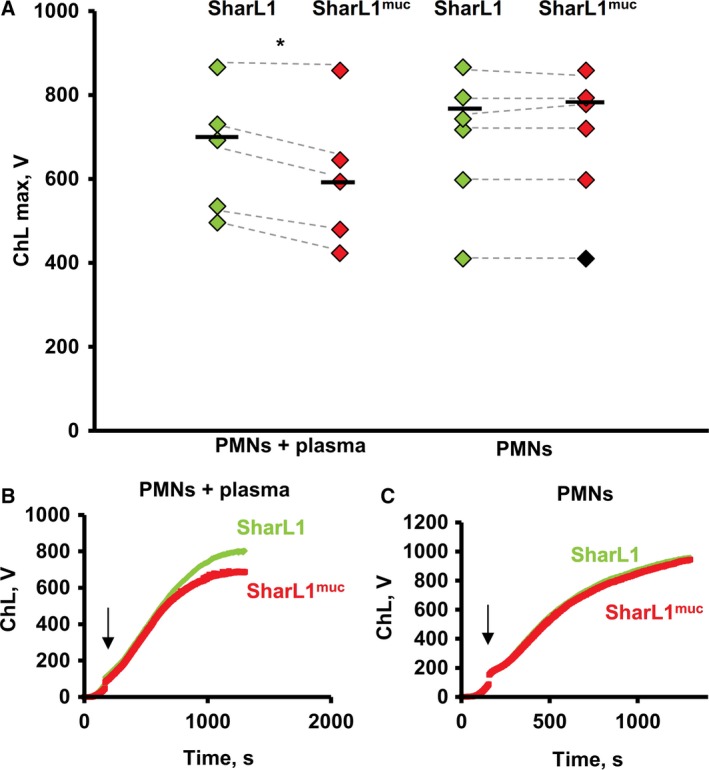
Figure 3.

ChL response of isolated neutrophils in the presence of plasma and without plasma stimulated by SharL1 and SharL1muc. Peak values for ChL are shown as white diamonds (SharL1) and black diamonds (SharL1muc). Values for the same neutrophil sample are connected with the dotted lines (four experiments were performed with blood from three healthy donors). Medians for SharL1 and SharL1muc are indicated with horizontal bars (A). Typical kinetics of the ChL response of the isolated neutrophils with (B) and without (C) plasma after stimulation with SharL1 (grey) and SharL1muc (black). Arrows show the time point when the bacteria were added. *Significant difference between the ChL stimulated by SharL1 and SharL1muc (P < 0.05, paired t‐test). Maximum values of ChL stimulated by 0.15 NaCl and 0.15 NaCl + mucin were 4.23 + 0.78 and 5.03 + 1.27, correspondingly (those values did not depend on plasma addition to isolated neutrophils).
