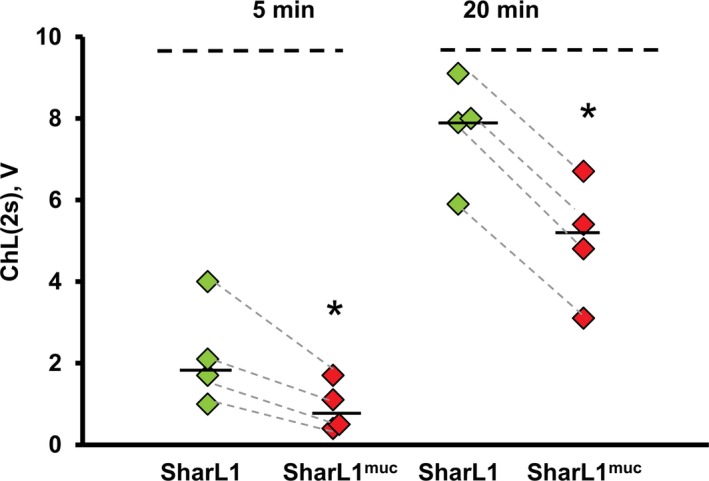
Figure 4.

ChL response registered in the blood samples (n = 4) after 5 or 20 min of co‐incubation with SharL1 or SharL1muc. The ChL response was measured 2 s after the addition of the blood samples with bacteria to the cuvette. Values for the same blood sample are connected with dotted lines. Median values for SharL1 (white diamonds) and SharL1muc (grey diamonds) are indicated with a horizontal line. *P < 0.05 (paired t‐test) for SharL1muc vs SharL1. *Significant difference between ChL stimulated by SharL1 and SharL1muc P < 0.05 (paired t‐test). Maximum values of ChL stimulated by 0.15 NaCl and 0.15 NaCl + mucin were 0.47 + 0.09 and 0.48 + 0.13, correspondingly.
