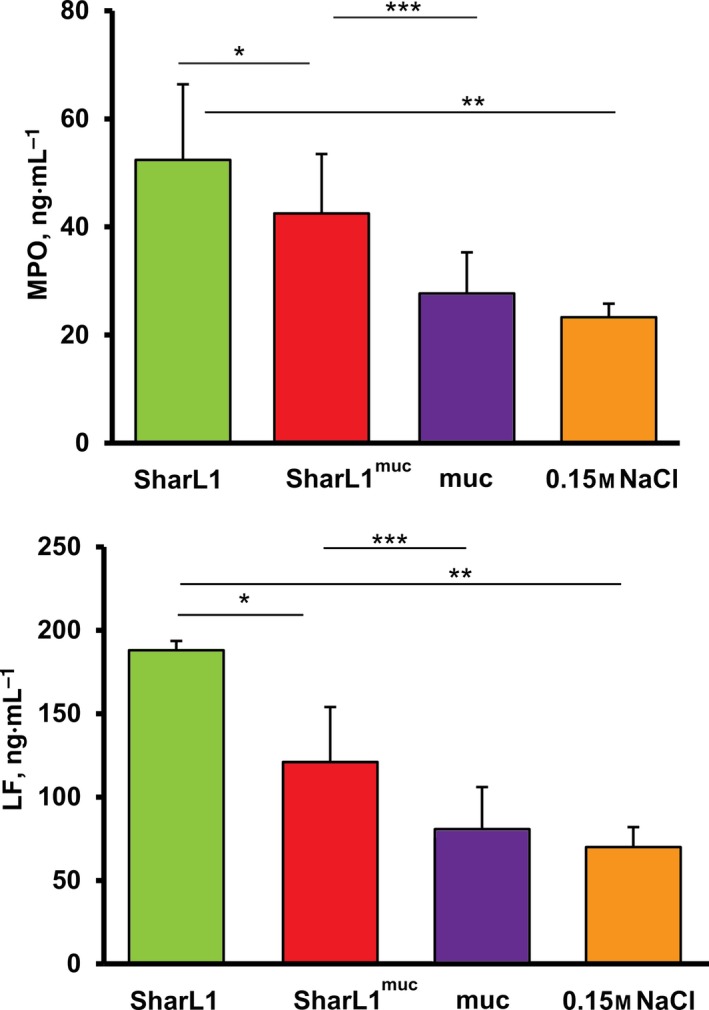
Figure 6.

Myeloperoxidase and LF concentration in plasma from blood samples [assays were performed with the blood of five healthy donors (LF) or 4 (MPO)] after 5 min of incubation of blood with SharL1muc, SharL1, mucin (20 µg·mL−1) or 0.15 m NaCl. The group comparison was performed by pairwise comparison of values achieved for each donor. Asterisks indicate significant differences according to the t‐test. *P < 0.05 SharL1muc vs SharL1; **P < 0.05 SharL1 vs 0.15 m NaCl; and ***P < 0.05 SharL1muc vs muc. The error bars represent SD.
