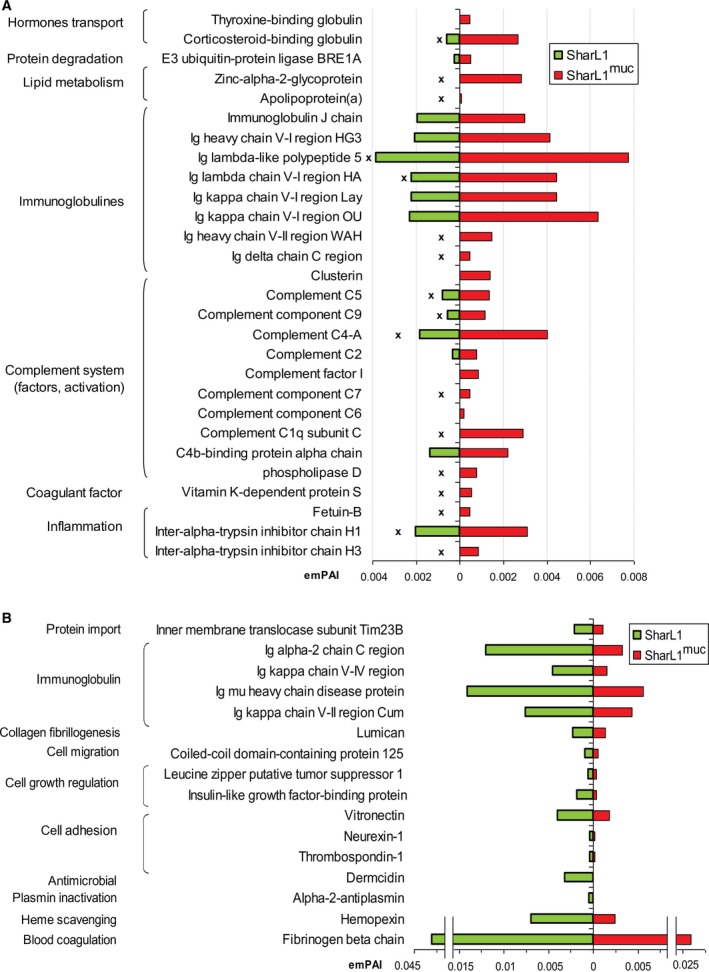
Figure 7.

The difference in plasma proteins detected by HPLC‐MS/MS after incubation of blood with SharL1muc and SharL1. Protein relative abundances (emPAI coefficients) are shown. The emPAI of each protein was averaged for two biological repeats and normalized to the total emPAI of the sample. Protein was included if the averaged normalized emPAI in SharL1muc and SharL1 differed by more than 1.5‐fold and no effect was demonstrated by the mucin vs 0.15 m NaCl comparison (File S3). Protein functions were determined according to the UniProt database. ‘x’ indicates proteins which contents in the SharL1 plasma samples were the lowest (compared to plasma from blood incubated with the mucin solution or 0.15 mm NaCl). (A) Proteins that were more abundant in samples with SharL1muc and (B) proteins that were more abundant in samples with SharL1.
