
Figure 1.
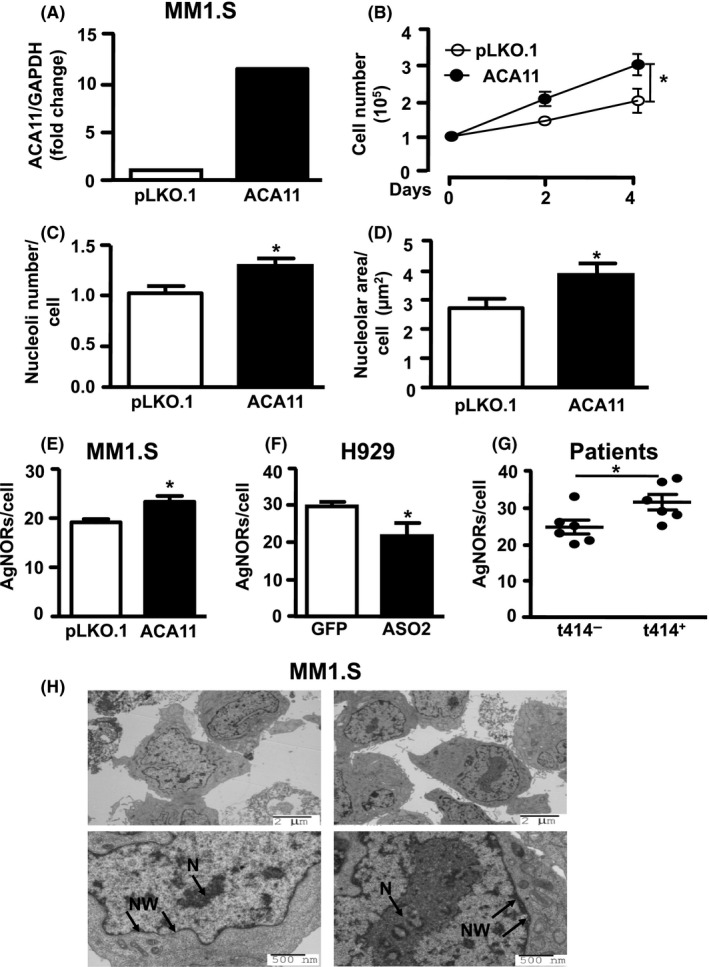
ACA11 overexpression alters nucleolar characteristics in multiple myeloma (MM) cell lines and patient samples. A, real‐time quantitative reverse transcription PCR analysis of ACA11 snoRNA expression levels in MM1.S cells relative to glyceraldehyde 3‐phosphate dehydrogenase. B, MM1.S overexpressing ACA11 exhibits cell number increase compared to MM1.S cells infected with empty vector (pLKO.1). C, Quantification of nucleolar number and (D) area in MM1.S cells overexpressing ACA11 compared to pLKO.1 control. E, Quantitative analysis of AgNOR (Argyrophilic NORs) number in MM1.S cells overexpressing ACA11 compared to pLKO.1 control (F) in H929 cells with ACA11 knockdown compared to green fluorescent protein control; and (G) in MM Patient samples with t(4;14)‐positive MM compared to t(4; 14)‐negative MM. *P < 0.05. H, Representative transmission electron micrograph from MM1.S cells used in the quantification in (C) and (D) showing the effects of ACA11 overexpression on nucleolar morphology. N, nucleoli, M, ribosomes at nuclear membrane. Top panels were imaged at 4000X magnification and bottom panels at 8000X