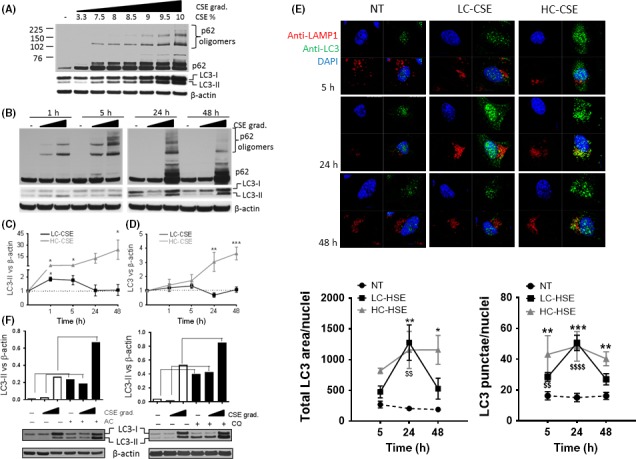
Figure 2.

Increased p62, LC3‐II, and total LC3 in bronchial epithelial cell line (BEAS‐2B) treated with cigarette smoke extract (CSE). (A) Whole‐cell extracts from BEAS‐2B cells that were treated with increasing concentration of CSE (3.3%‐10% v/v) for 24 h were analyzed by immunoblotting for LC3, p62, and β‐actin, n = 3 (B) Whole‐cell extracts from BEAS‐2B cells treated with a low and high concentration of CSE (LC‐CSE (3.3% v/v) and HC‐CSE (10% v/v)) at increasing time points (1‐48 h) and analyzed by immunoblotting for LC3, p62, and β‐actin, n = 4. (C) Autophagosomes (AP) formation was assessed by LC3‐II vs β‐actin from (B) and plotted. (D) Total LC3 proteins levels were assessed against β‐actin from (B). For (C) and (D) statistical analysis was performed using two‐way ANOVA for repeated measures with Bonferroni posttests. * P < .05, ** P < .01, *** P < .001. (E) APs were detected by confocal microscopy using a rabbit anti‐LC3 antibody conjugated to 488 Donkey Anti‐rabbit and lysosomes were detected by using mouse anti‐LAMP1 antibody conjugated to anti‐mouse APC. DAPI was used to visualize nuclei. Cells were incubated with CSE as described in (B) Scale bar: 10 μm. Statistical analysis was performed by comparing HC (*) and LC‐CSE ($) vs NT control P < .05, P < .01, P < .0001. Data are expressed as median ± SD of n = 3. * means comparing NT vs HC‐CSE; * P < .05, ** P < .01, *** P < .001. (F) An “LC3 turnover” assay was performed by incubating BEAS‐2B cells with LC‐CSE and HC‐CSE for 19 hours plus 5 hours in the presence of ammonium chloride (AC, left graph, 10mM) or chloroquine (CQ, right graph, 100 µmol/L). The amount of LC3‐II was plotted against β‐actin. Data are expressed as median ± SEM
