Figure 1.

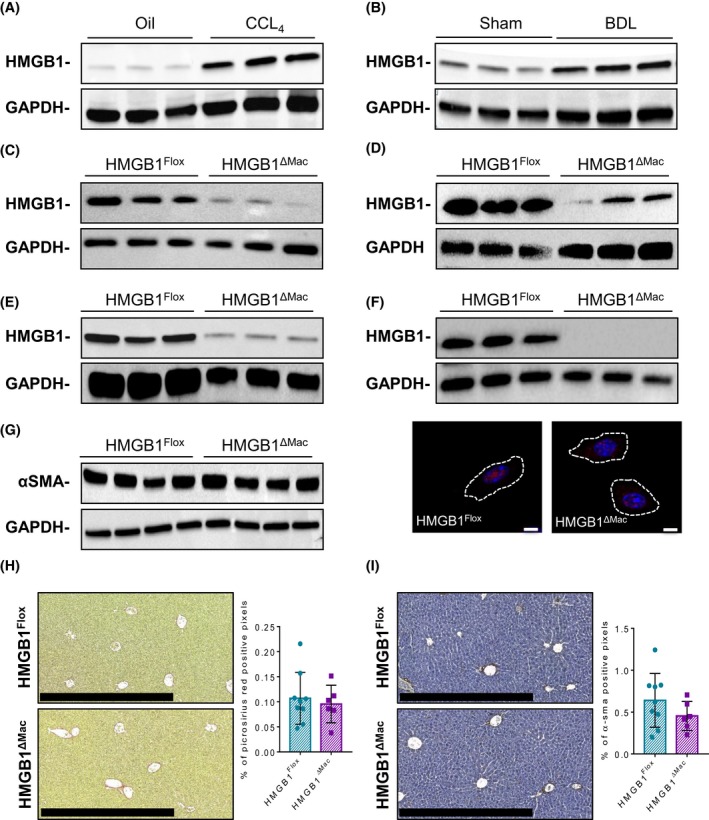
High mobility group B1 (HMGB1) regulation during fibrosis and validation and characterization of macrophage‐specific deletion of HMGB1. Representative immunoblotting against HMGB1 in oil (n = 9) or CCL4‐treated (n = 15) liver using glyceraldehyde‐3‐phosphate dehydrogenase (GAPDH) protein as a loading control (A). Representative immunoblotting against HMGB1 in liver extracts from sham (n = 9) or BDL (n = 4) animals using GAPDH protein as a loading control (B). Peritoneal macrophages isolated from HMGB1Flox (n = 3) and HMGB1ΔMac mice (n = 3) were analyzed by immunoblotting against HMGB1 and GAPDH (C). Cells from liver stromal vascular fraction, isolated from HMGB1ΔMac and HMGB1Flox mice, were analyzed by immunoblotting against HMGB1 and GAPDH (D). Cells from lung stromal vascular fraction, isolated from HMGB1Flox (n = 3) and HMGB1ΔMac mice (n = 3), were analyzed by immunoblotting against HMGB1 and GAPDH (E). Bone marrow‐derived macrophages (BMDM) isolated from HMGB1Flox (n = 3) and HMGB1ΔMac mice (n = 3) were analyzed by immunoblotting against HMGB1 and GAPDH (higher panel). BMDM isolated from HMGB1Flox and HMGB1ΔMac mice were analyzed by immunofluorescence confocal microscopy to detect HMGB1 (red) while nuclei were stained with DAPI (blue) (lower panel). Scale bar: 5 μm (F). Liver extracts of HMGB1Flox (n = 9) and HMGB1ΔMac (n = 6) mice were analyzed by western blotting directed against α‐smooth muscle actin (α‐SMA) (G). Representative images of liver fibrosis determined by picosirius Red staining from HMGB1Flox (n = 9) and HMGB1ΔMac (n = 6) mice. Scale bar: 500 μm (H). Representative images of myofibroblast activation determined by α‐SMA immunostaining from HMGB1Flox (n = 9) and HMGB1ΔMac (n = 6) mice liver sections. Scale bar: 500 μm (I)
