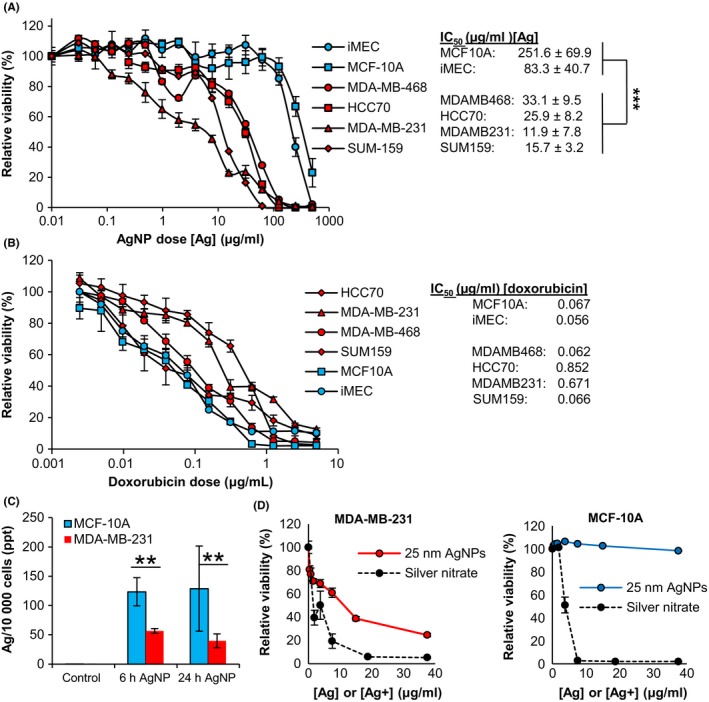
Figure 2.

Assessment of the role of silver ion and reactive oxygen species in the cytotoxicity of AgNPs. A, Non‐malignant breast cells (white symbols) or TNBC cells (gray symbols) were exposed to 25 nm AgNPs for 72 h and viability was assessed by MTT assay. The IC50 of 25 nm AgNPs for each cell line is shown to the right. Data were obtained from 4‐6 technical replicates and 3 independent experiments depending upon cell line. Statistical analysis to compare IC50s for TNBC cells vs non‐malignant cells was performed by two‐way ANOVA and post‐hoc Tukey Test. Significant differences are indicated (***P < .001). B, Cells were exposed to doxorubicin for 72 h and viability was assessed by MTT assay. The IC50 dose of doxorubicin for each cell line is shown to the right. Data were obtained from 6‐8 technical replicates and are representative of duplicate independent experiments. C, Uptake of 25 nm AgNPs was quantified by ICP‐MS. Data were obtained from 3 technical replicates and duplicate independent experiments. Statistical analysis was performed by Student's T‐Test. Significant differences are indicated (**P < .01). D, Cells were exposed to 25 nm AgNPs or an equivalent silver concentration of AgNO3 for 48 h and viability was assessed by MTT. Data were obtained from 6 technical replicates and are representative of duplicate independent experiments
