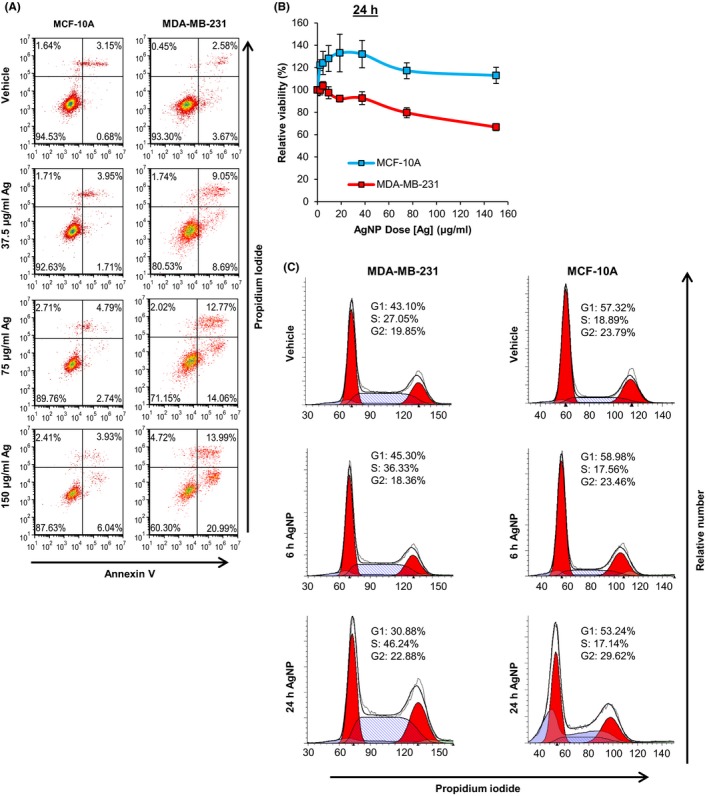
Figure 5.

Assessment of the effect of AgNPs on cell cycle and cell death in MDA‐MB‐231 and MCF‐10A cells. A, MDA‐MB‐231 or MCF‐10A cells were treated with PVP‐stabilized, 25 nm AgNPs for 48 h, co‐stained with PI and AnnV, and then evaluated by flow cytometry. The percentages of cells characterized as viable (lower‐left quadrant), early apoptotic (lower‐right quadrant), late‐apoptotic (upper‐right quadrant), and necrotic (upper‐left quadrant) are shown within each quadrant. The presented data are representative of duplicate independent experiments. B, MDA‐MB‐231 or MCF‐10A cells were treated with 25 nm AgNPs for 24 h and viability was assessed by MTT assay. Data were obtained from 4‐6 technical replicates and 3 independent experiments depending upon cell line. C, MDA‐MB‐231 or MCF‐10A cells were treated with 37.5 µg/mL of 25 nm AgNPs for 6 or 24 h. Cells were fixed, permeabilized, and stained with PI, and then cell cycle analysis was performed by flow cytometry. The relative proportion of cells in each phase of the cell cycle is indicated. Sub‐G0/G1 cell populations indicative of apopotosis were excluded from the analysis
