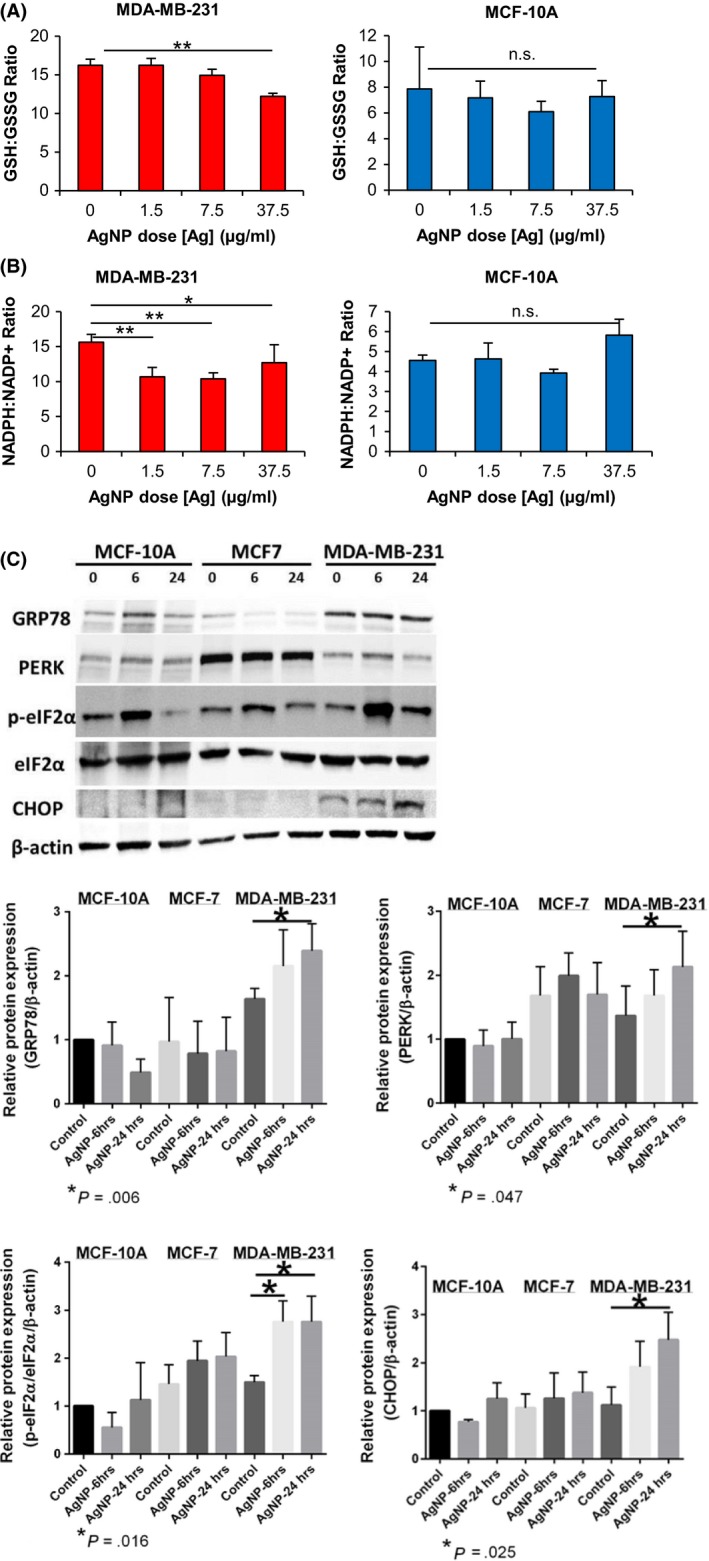
Figure 6.

Quantification of oxidative and ER stress in triple‐negative breast cancer and non‐malignant breast cells. The ratios between (A) reduced and oxidized glutathione (GSH/GSSH) or (B) reduced and oxidized nicotinamide adenine dinucleotide phosphate (NADPH/NADP+) were quantified in cell lysates following sublethal exposure of MDA‐MB‐231 or MCF‐10A cells to AgNPs for 24 h. Data were obtained from 4 technical replicates and are representative of duplicate independent experiments. Statistical analysis was performed by one or two‐way ANOVA and post‐hoc Tukey Test. Significant differences between treatment groups are indicated (*P < .05; **P < .01; NS, non‐significant (ANOVA, P > .05)). (C) MDA‐MB‐231, MCF‐7, and MCF‐10A were treated with AgNPs for 6 or 24 h, and then cell lysates were analyzed for markers of ER stress and activation of the unfolded protein response by western blot, as indicated. Representative western blots show that AgNPs induce ER stress in MDA‐MB‐231 cells but not in MCF‐7 or MCF‐10A cells. Protein levels relative to the β‐actin loading control were quantified by densitometry. Expression of PERK, p‐eIFα/total eIFα, GRP78, and CHOP is shown relative to levels detected in untreated MCF‐10A cells. Data were obtained from 5 independent experiments. Statistical analysis for each cell line was performed by one‐way ANOVA and post‐hoc Student's t test. Significant differences (*P < .05) in protein levels relative to baseline for each cell line are shown with P‐values indicated in each panel
