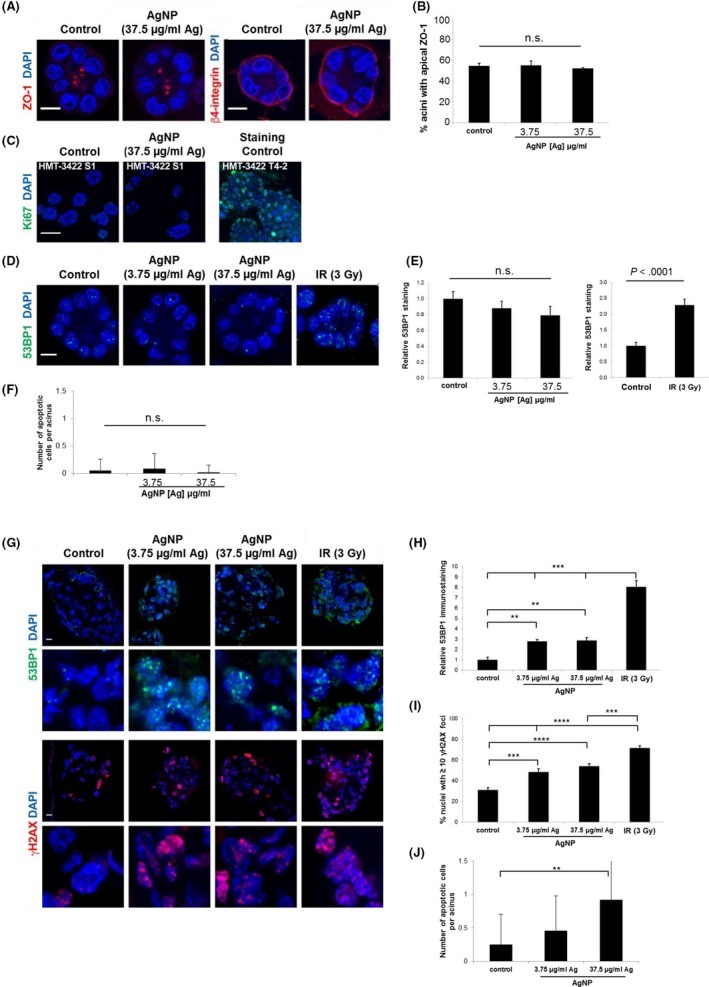
Figure 7.

Quantification of DNA damage and apoptosis in triple‐negative breast cancer tumor nodules and non‐malignant breast cells grown in 3D cell culture. A, Representative confocal images of non‐malignant S1 acini treated for 48 h with 3.75 or 37.5 μg/mL of AgNP or with PBS (control) and immunostained for the tight junction marker ZO‐1 or the basal marker β4 integrin. Nuclei were counterstained with DAPI. B, Quantification of apical ZO‐1 localization in acini treated as in (A). Mean ± standard error from 3 independent biological replicates are shown. At least 100 structures were scored per condition for each replicate. No significant differences were detected between treatment groups (NS; ANOVA, P > .05). C, Staining for the proliferation marker Ki67 in S1 acini differentiated in 3D culture. Ki67 staining was validated by parallel analysis of S1‐derived T‐42 breast cancer cells. D, Detection of DNA damage by immunostaining for 53BP1 in S1 acini treated with AgNP or PBS. Exposure of acini to ionizing radiation (3 Gy, IR) was used for validation. E, For each acinus cross‐section, the average number of 53BP1 foci/nucleus in confocal images of S1 acini was quantified to determine if DNA damage was induced by AgNP exposure. The bar graph represents mean ± standard error (N > 20 acini from two independent biological replicates) after normalization to PBS‐treated cells. No significant differences between AgNP treatment groups was detected (NS; ANOVA, P > .05). However, significant differences (t test; P < .0001) in 53BP1 foci were detected between acini exposed to IR or mock‐irradiated. F, The number of apoptotic cells per acinus was estimated based on pyknosis and karyorrhexis detected with DAPI staining of S1 acini treated as in (A). No significant differences in between treatment groups were detected (ANOVA; P > .05; N > 20 acini from two independent biological replicates). Scale bars = 10 µm. G, Detection of 53BP1 (green) and phosphorylated H2AX (γH2AX, red) by confocal microscopy in MDA‐MB‐231 cells cultured in 3D with Matrigel. Cells were treated for 48 h with PBS (control) or AgNPs. Exposure to 3 Gy of ionizing radiation (IR) served as positive control for DNA damage detection. Scale bars = 10 µm. Zoomed images are shown in the lower panels for each stain. H, For each nodule cross‐section of MDA‐MB‐231 cells treated as in (G), the average number of 53BP1 foci/nucleus was scored. Means ± standard error are shown after normalization to control. Significant differences between treatment groups were detected as indicated (ANOVA; **P < .01 and ***P < .001; N ≥ 7 nodules from two independent biological replicates). I, The proportion of nuclei with at least 10 γH2AX foci per cross‐section in MDA‐MB‐231 cells treated as in (G). Significant differences between treatment groups were detected as indicated (ANOVA; ***P < .001 and ****P < .0001; N = 9 nodules from two independent biological replicates). J, The number of apoptotic cells per nodule was estimated based on pyknosis and karyorrhexis detected with DAPI staining in confocal images of MDA‐MB‐231 tumor nodules treated as in (G) and significant differences in between treatment groups were detected as indicated (ANOVA and post‐hoc Tukey test; ** P < .01; N = 9 nodules from two independent biological replicates). Scale bars in A, C, D, G = 10 µm
