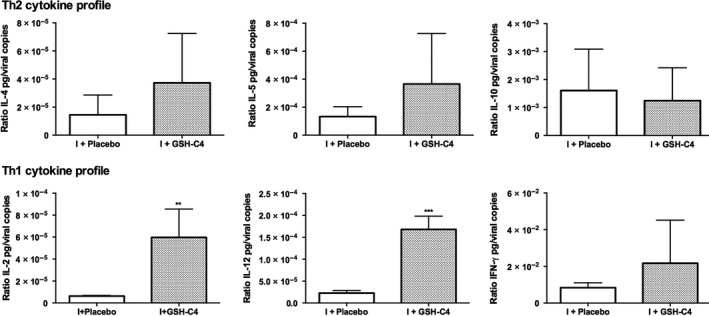
Figure 7.

Th1 and Th2 cytokine profile in infected aged mice. Production of Th2 cytokines (IL‐4, IL‐5, IL‐10) (above) and of Th1 cytokines (IL‐2, IL‐12, IFN‐γ) (below) in BALF obtained from infected mice either treated with Placebo (I + Placebo) or GSH‐C4 (I + GSH‐C4) at day 8 pi. Cytokine assays were performed as described in the Materials and Methods section. Values, reported as ratio of IL pg/viral copies, represent the mean ± SD of five mice, each run in duplicate (n = 10). Unpaired data were analyzed with the Student's t test with Welch correction: **P = 0.0098, ***P = 0.0003 vs I + Placebo
