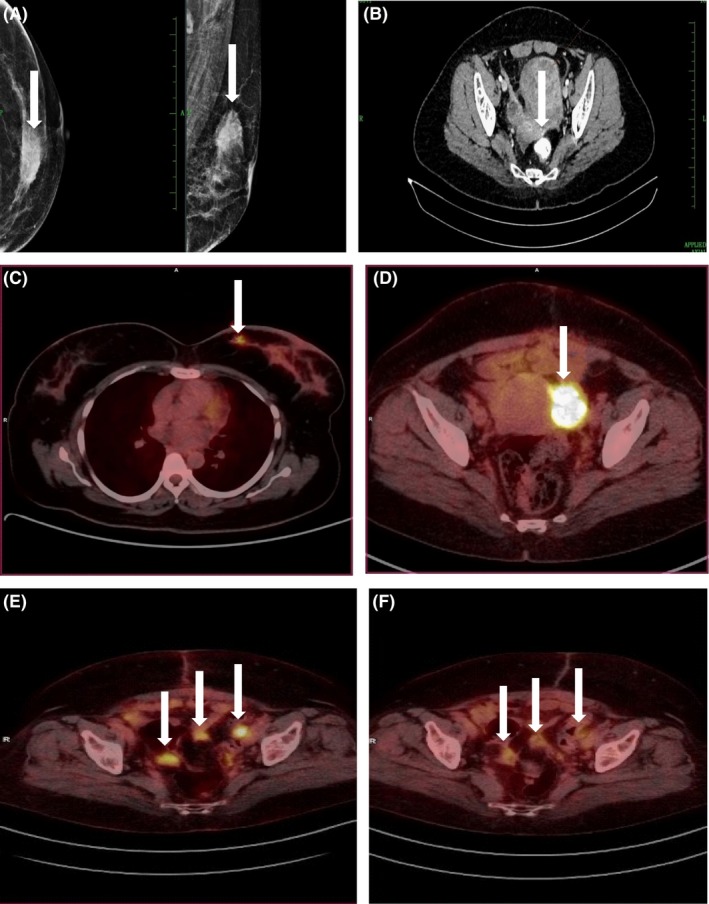
Figure 1.

Screening of breast and ovarian tumors by imaging. (A) Left image: mammogram of left breast lesion indicated by an arrow. (B) CT scan of ovarian lesion indicated by an arrow. (C and D) FDG‐PET/CT image of breast and ovarian lesions indicated by an arrow, respectively. (E) FDG‐PET/CT image of ovarian tumor before neoadjuvant paclitaxel and carboplatin drug therapy, and (F) tumor size reduction after three cycles of combined drug therapy with lesions indicated by arrows before and after therapy
