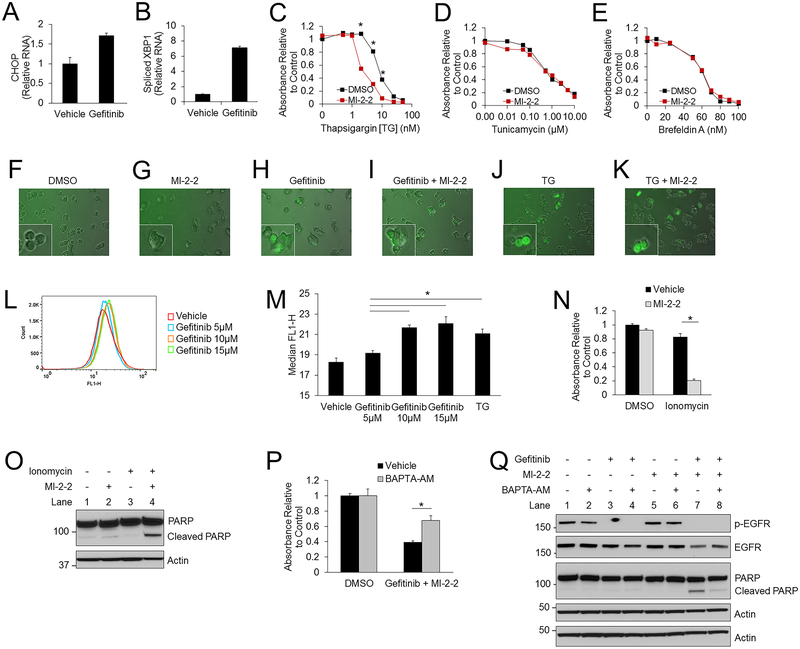
Figure 3: Increased cytosolic calcium is important for gefitinib mediated suppression of CRC cells.
A-B) HT-29 cells treated for 48 hours and then CHOP mRNA (A) and spliced XBP1 mRNA (B) were assessed by RT-PCR and plotted relative to actin. 10 μM gefitinib. C-E) HT-29 cells treated with varying concentrations of thapsigargin [TG] (C), tunicamycin (D), and brefeldin A (E), with and without 1 μM MI-2–2. Cell growth was assessed after 96 hours by the MTS assay. F-K) HT-29-GCaMP6f cells treated for 24 hours. Images were obtained at 200X. 1 μM MI-2–2, 10 μM gefitinib, 2 nM TG. L-M) HT-29-GCaMP6f cells treated with either gefitinib (L) or 2nM TG for 72 hours and then cytosolic calcium levels were analyzed by flow cytometry, with the median FLH-1 values reported (M). N) HT-29 cells treated for 96 hours with cell growth assessed by the MTS assay. 10 μM ionomycin, 1 μM MI-2–2. O) HT-29 cells treated for 96 hours, with protein analyzed by western blot. 5 μM ionomycin, 1 μM MI-2–2. P-Q) HT-29 cells treated for 96 hours with cell growth assessed by the MTS assay (P), and treated for 48 hours with protein analysis by western blot (Q). 10 μM gefitinib, 1 μM MI-2–2, 5 μM BAPTA-AM. * p < 0.05.

