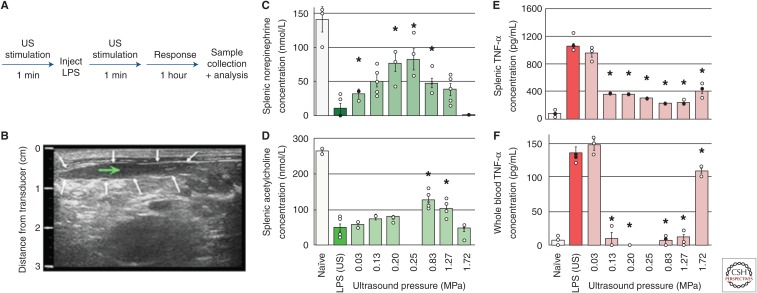
Figure 2.
Splenic ultrasound (US) Neuromodulation of the cholinergic anti-inflammatory pathway (CAP) (Cotero et al. 2019). (A) A timeline of the US CAP stimulation performed (with the US stimulus applied directly to the spleen). (B) US images were used to locate the US stimulus (white arrows—outline of the spleen; green arrow—target point for US stimulation). (C–E) Splenic concentrations of CAP signaling molecules, including norepinephrine (C), acetylcholine (D), and tumor necrosis factor α (TNF-α) (E) are shown for naïve animals, sham controls (lipopolysaccharide [LPS], US), and with US stimulation (0.03–1.72 MPa). (F) Whole-blood concentrations of TNF-α for the same conditions as E. The asterisks mark statistical significance using two-sided t-test versus LPS-only controls (threshold 0.05). (From Cotero et al. 2019; reprinted, with permission, from Nature Communications © 2019.)

