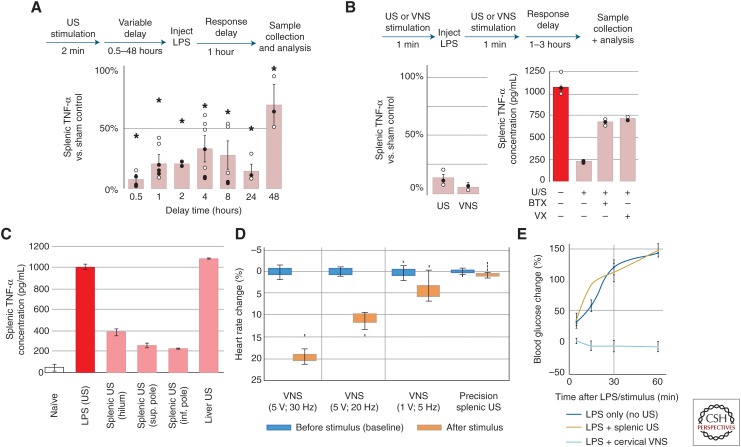
Figure 3.
Comparison of splenic ultrasound (US) stimulus versus traditional cervical vagus nerve stimulation (VNS) stimulation of cholinergic anti-inflammatory pathway (CAP) (Cotero et al. 2019). (A) Splenic tumor necrosis factor (TNF) concentrations shown after protective US treatments with delay times from 0.5 to 48 h prior to lipopolysaccharide (LPS) injection. The asterisks mark statistical significance using two-sided t-test versus LPS only controls (threshold 0.05). (B) (left) Relative concentrations of splenic TNF are shown for US-stimulated (left) versus implant-based VNS treated animals. (right) Data showing the effect of α-bungarotoxin (BTX) or surgical (cervical) vagotomy on splenic concentrations of TNF after US stimulation. (C) Data showing specificity in the modulated TNF response for splenic versus liver US stimulation, but similar TNF response at different splenic stimulation locations. (D) Data comparing the effect of VNS and splenic US stimulation on heart rate. (E) Data confirming the VNS effect on LPS-induced hyperglycemia and absence of this effect when using splenic US stimulation. (From Cotero et al. 2019; reprinted, with permission, from Nature Communications © 2019.)

