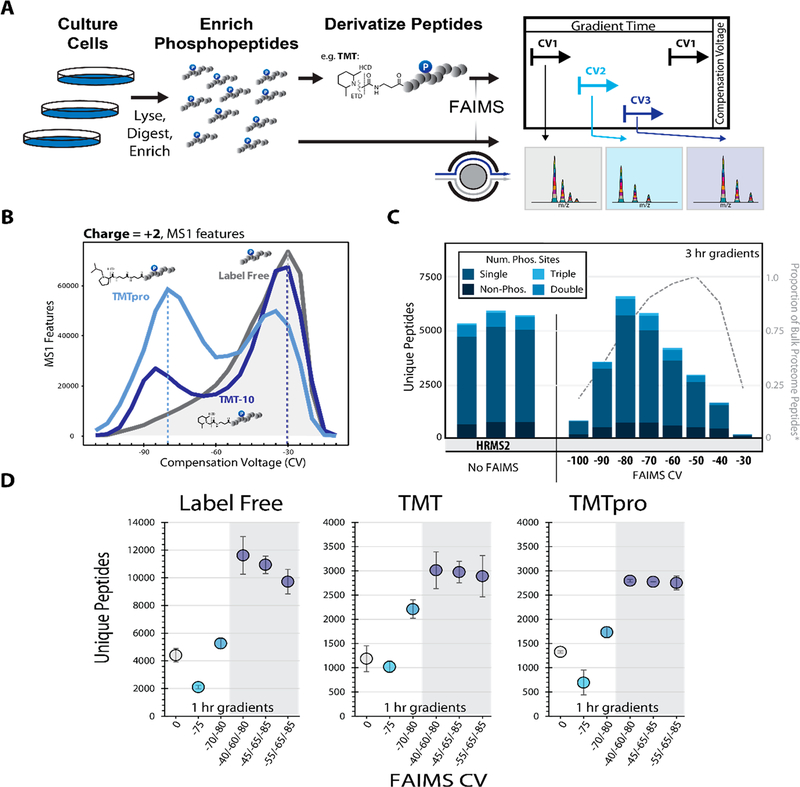
Figure 1.
Optimizing the FAIMS compensation voltage (CV) for phosphopeptide analysis. A. General FAIMS workflow for phosphopeptide analysis. Samples were processed using a modified SL-TMT protocol in which phosphopeptides were enriched prior to TMT labeling. The resulting peptides were analyzed by a FAIMS-Pro-equipped Orbitrap Fusion or Fusion Lumos mass spectrometer. B. MS1 features (z = +2) detected at varying compensation voltages (−110 V to −10 V). C. Unique peptides (divided by degree of phosphorylation) identified by various data acquisition methods. All data were collected with high-resolution MS2 (HRMS2) without FAIMS (in triplicates) or with CVs ranging from −100 to −30 V (no peptides were identified at −110 V or −20 V). Dotted line represents the proportion of non-phosphorylated peptides.11 D. Comparison of unique peptides identified as label-free (left), and derivatized with TMT reagent, (i.e., TMT, middle or TMTpro, right). Analyses were performed in triplicate. Error bars are standard deviations.

