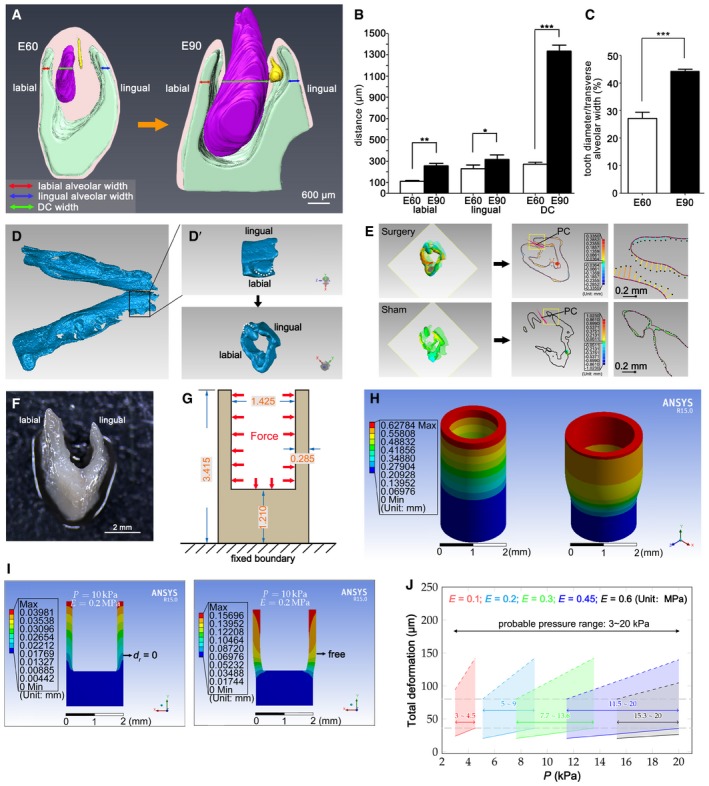
Three‐dimensional reconstruction of serial H&E frontal sections of miniature pig mandibles at embryonic day 60 (E60) and day E90; deciduous canine (DC) in purple, permanent canine (PC) in yellow, and alveolar socket in green. The red, blue, and green arrows indicate the width of the labial alveolar socket, lingual alveolar socket, and DC, respectively. n = 3.
DC and labial and lingual alveolar socket widths in the horizontal plane at the bottom of the PC during E60 and E90. n = 3.
The proportion of DC width relative to the total alveolar socket width during E60 and E90. n = 3.
Micro‐CT imaging of the whole mandible at E60; boxed region is magnified in D’ (top panel). (D’) Mandible slice isolated with Geomagic software. White dashed lines mark DC.
3‐D color map (left) after alignment of mandible slices before and after (sham) surgery showing a comparison of the surface points. Coronal sections through cusp tips (transparent squares, left) were selected for 2‐D comparisons (middle); right panels are magnifications of yellow‐boxed regions. The solid purple contour and dotted black contour indicate the pre‐ and post‐surgery shapes, respectively. The distance between the two contours is the colored line segments showing the distance and direction of the movement. The colored ball in the 2‐D comparison marks the position of the maximum displacement. The PC position is indicated in pink. n = 3.
Dissected mandible slice with a “U” shape.
In the cup model, the mandible slice was simplified as a cup according to its dimensions (unit, mm). Red arrows indicate the uniform force (stress) exerted on the inner wall of the mandible. The bottom of the cup was fixed to avoid rigid body motions.
3‐D color map shows the extent of deformation based on the cup model established with ANSYS software.
Probable range of mechanical stress inside the mandible evaluated by multiple simulation tests in which serial stress and Young's modulus were inputted into the cup model; the cup was set with the outer surface fixed (left, d
r = 0 denotes that radial deformation of the outer surface equals 0) or the outer surface free (right).
Deformation of the mandible walls under a series of stress levels with different Young's moduli. Data were obtained from multiple tests as in (I). Gray horizontal lines indicate upper and lower limit values of mean mandible wall displacement (79.74 and 36.48 μm, respectively); dashed colored lines indicate results of the free outer surface; solid colored lines indicate results of the fixed outer surface (with consideration of good linearity of the simulation results, the corresponding result points of the simulation series were omitted and replaced by solid or dashed colored lines for clarity); the actual stress value should be between the two extreme boundary conditions. Results show that the probable stress level ranged from 3 to 20 kPa. n = 3.
Data information: Data represent the means ± SEM. Unpaired
0.001.

