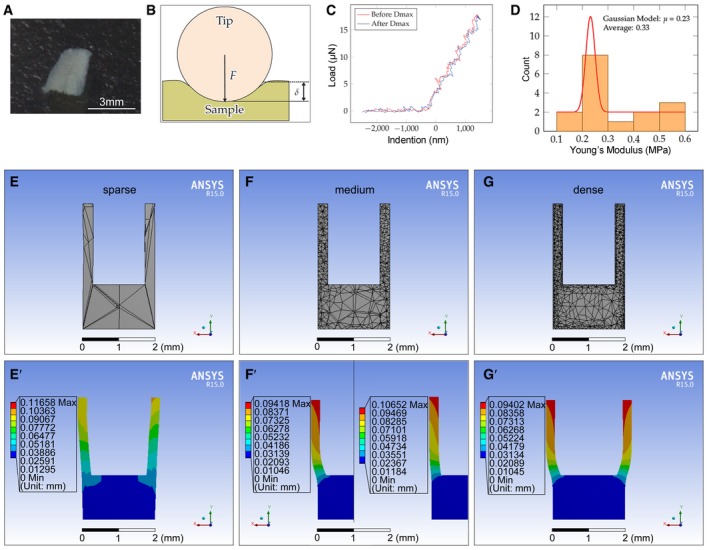
Figure EV2. Mechanical test and establishment of the cup model.

-
A–DTesting Young's moduli of the samples. (A) Mandible bony piece (mandible side wall piece) prepared for the test (0.2–0.3 mm in thickness). (B) Diagram of the testing principle of nanoindentation for Young's modulus determination using the Piuma Chiaro Nanoindenter. The indenter (tip) applies force onto the sample (mandible bony piece in A) and records the force applied and the indentation depth (sample deformation). (C) Normal force spectrum from which valid experimental data were extracted. The red line signifies that the probe was engaging before reaching max deformation (Dmax); blue line indicates that the probe retreated after reaching Dmax. (D) Distribution of the typically measured Young's moduli of the samples. Red line indicates the fitting results of the Gaussian model.
-
E–GGradient densities of the mesh (sparse, medium, and dense) were tested to determine the optimal mesh density of the cup for the computation. (E, E’) The deformation is not symmetrical although it is clear in the sparse group. (F, F’ left, G, and G’) The medium and dense groups show similar deformation after exerting a force on the inner wall. (F’) Series of Poisson's ratios, including 0.15 (not shown), 0.35 (left), and 0.48 (right), were tested. Dmax values of the three cases were 1, 1.21, and 1.37 after normalizing the data.
