-
A–C
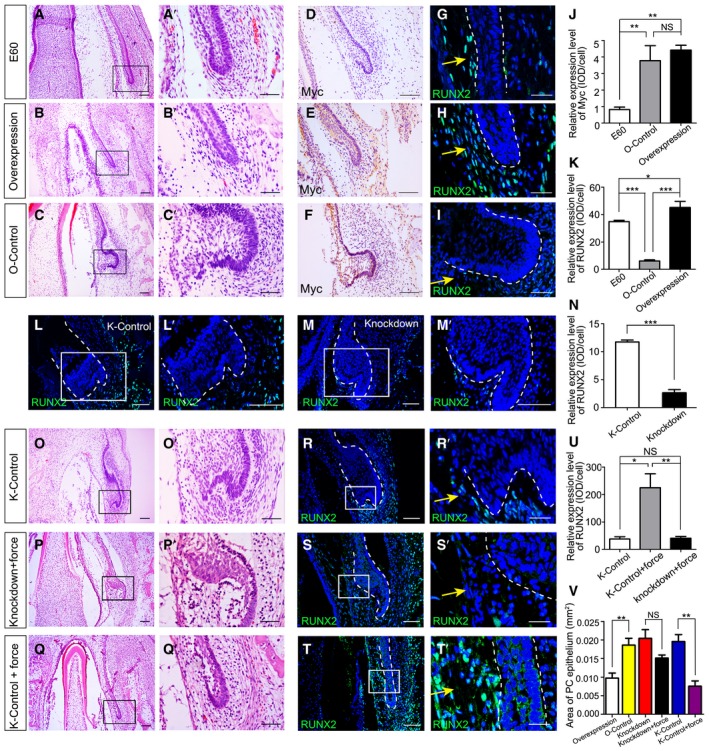
H&E staining of miniature pig canine frontal sections from embryonic day 60 (E60 group) (A) and after the mandible slices were infected with RUNX2 overexpression lentiviral vector with a Myc tag (overexpression group) (B) or overexpression control lentiviral vector with a Myc tag (O‐control group) (C); (A’–C’) are magnifications of boxed regions in the corresponding figure panels.
-
D–F
Immunohistochemical (IHC) staining of Myc expression in mandible slices from the E60, overexpression, and O‐control groups.
-
G–I
IF staining of RUNX2 expression (yellow arrows) in mandible slices of the E60, overexpression, and O‐control groups.
-
J, K
Relative expression levels of Myc and RUNX2 in the E60, O‐control, and overexpression groups.
-
L, M
IF staining of RUNX2 expression after infecting mandible slices with scrambled shRNA lentiviral vector (knockdown control, K‐control) (L) or RUNX2 shRNA lentiviral vector (knockdown) (M); (L’–M’) are magnifications of boxed regions in the corresponding figure panels.
-
N
Relative RUNX2 expression levels between K‐control and knockdown groups.
-
O–Q
H&E staining of mandible slice sections from the K‐control, knockdown + force (3 kPa), and K‐control + force (3 kPa) groups. (O’–Q’) are magnifications of boxed regions in the corresponding figure panels.
-
R–T
IF staining of RUNX2 expression (yellow arrows) of mandible slice sections from the K‐control, knockdown + force (3 kPa), and K‐control + force (3 kPa) groups. (R’–T’) are magnifications of boxed regions in the corresponding figure panels.
-
U
Relative RUNX2 expression levels among the three groups in (R–T).
-
V
PC epithelium areas in the overexpression, O‐control, knockdown, knockdown + force, K‐control, and K‐control + force groups.
Data information: Data represent the means ± SEM.
= 3 for all experiments. Scale bars = 100 μm (D–F), 25 μm (R’–T’), and 50 μm (other panels). Dashed lines mark the outlines of PCs. Unpaired
‐tests for (N and V); one‐way ANOVA (Newman–Keuls test for post hoc comparisons between two groups) for (J, K, and U), *
0.001.

