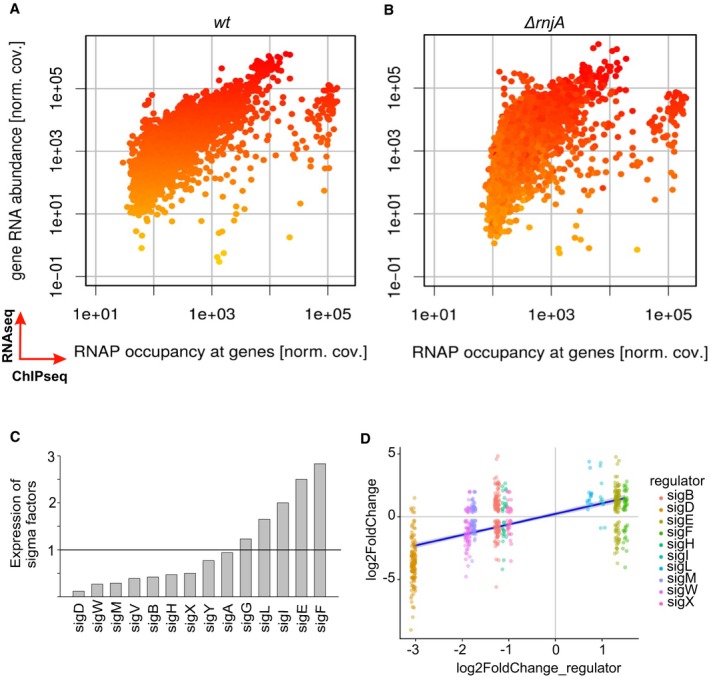
Figure 1. Global changes in ΔrnjA compared to wt.

-
A, BComparisons of RNAseq and ChIPseq data. Wt strain (A) and ΔrnjA (B). The x‐axis shows the relative RNAP occupancy at a given gene (normalized ChIPseq coverage). The y‐axis shows the relative abundance of the transcript (normalized RNAseq coverage; each dot is one gene). The genes are color‐coded, ranging from yellow (low RNA abundance) to red (high RNA abundance) in wt. The ΔrnjA strain has higher RNAP occupancy mainly among the genes with less abundant transcripts. The color coding in (B) reveals no dramatic overall changes in the vertical direction (RNA abundance). If anything, some of the low abundance transcripts decreased further in level in the mutant strain. The main difference (mostly among the low abundance transcripts) is their shift in the horizontal direction to the right (toward higher occupancy with RNAP). Data represent mean values of three independent experiments.
-
CRelative expression of all sigma factors in wt (LK1371) vs. ΔrnjA (LK1381). Wt levels of each sigma factor were set as 1 (indicated with the horizontal line).
-
DSigma‐dependent genes and correlation with expression of sigma factors (significantly changed) in ΔrnjA (LK1381). The most downregulated sigma factor was sigD, and almost all sigD‐dependent genes were downregulated. A similar trend is visible for the rest of sigma factors and their respective dependent genes. The x‐axis shows expression of each sigma factor, and the y‐axis shows expression of genes for each sigma regulon. The violet (dark blue) line: regression line.
Source data are available online for this figure.
