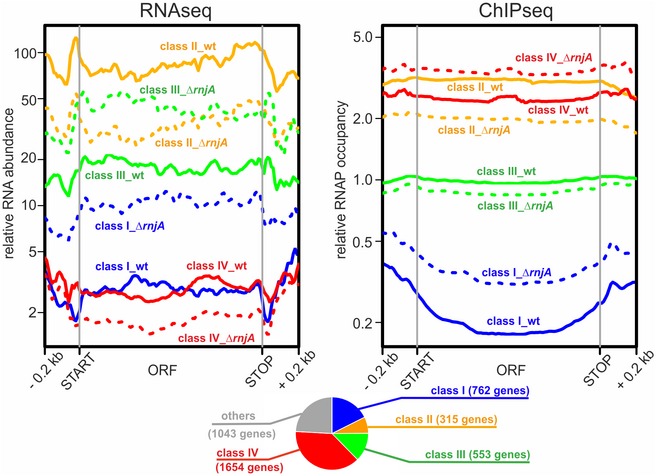
Figure 2. Class I, II, III, and IV genes.

Average gene profiles of normalized RNAseq and RNAP ChIPseq coverages from wt (solid lines) and ΔrnjA (dashed lines) strains were plotted for gene classes I–IV (n = 762, 315, 553, and 1,654 genes, respectively). Open reading frames were rescaled to 1 kb; upstream and downstream regions of 0.2 kb were also included in the plots. Data represent mean values of three independent experiments. For the definition of class I–IV genes, see text and Materials and Methods section “Gene classification (classes I–IV)”. The pie chart shows the overall distribution of classes I–IV and other genes.Source data are available online for this figure.
