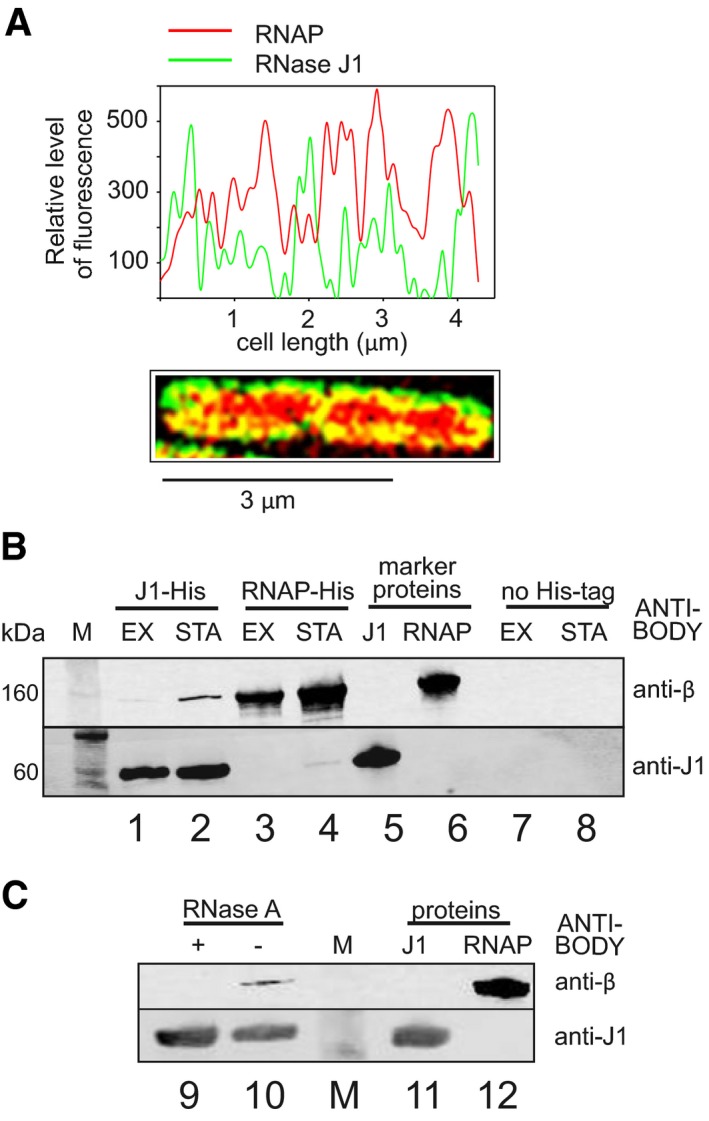
Figure 3. RNAP and RNase J1 may interact in the cell.

- SIM of exponential Bacillus subtilis cells. RNase J1 was fused to GFP (green), RNAP to mCherry (red). The graph shows relative fluorescence intensities at the cell midsection (along the long axis); SIM of the cell is below. Yellow indicates colocalization of the two proteins.
- Pull‐down with RNase J1‐8xHis tag and RNAP‐10xHis tag and detection of the proteins with antibodies. Lanes 1 and 2—RNase J1‐8xHis was used to pull down RNAP; lanes 3 and 4—RNAP‐10xHis was used to pull down RNase J1; lanes 5 and 6—purified proteins were used as markers; lanes 7 and 8—strains without His‐tagged proteins were used as negative controls to demonstrate the specificity of the interaction. M, molecular size marker; EX, exponential phase; STA, stationary phase.
- Pull‐down with RNase J1‐8xHis tag from stationary phase cells—the same conditions as in (B). The samples then either were (lane 9) or were not (lane 10) treated with RNase A to detect whether the interaction was via RNA. Lanes 11 and 12—purified proteins were used as markers. The experiment was performed three times (biological replicates) with the same result.
Source data are available online for this figure.
