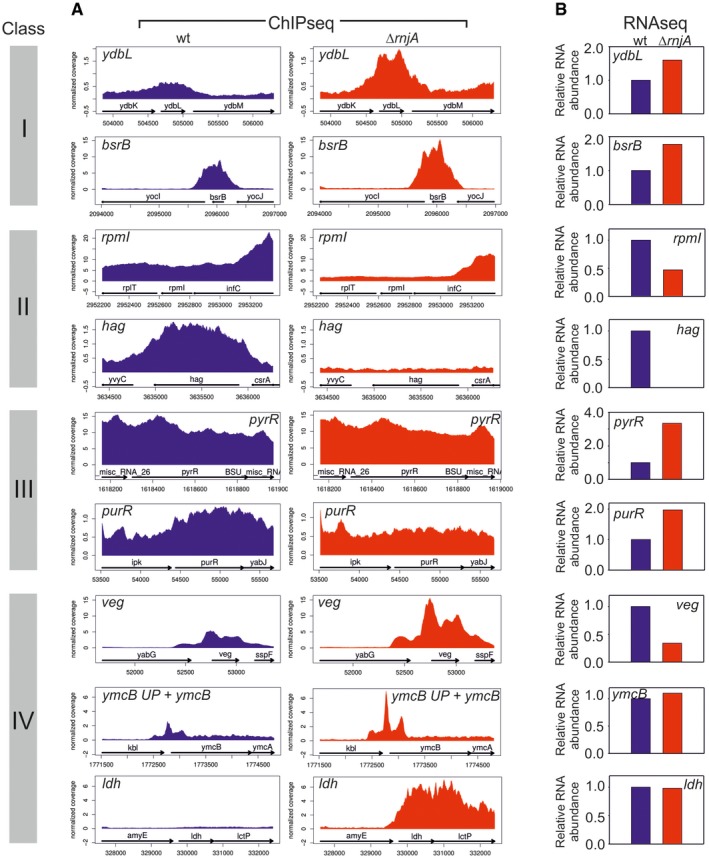
Figure EV3. Detailed comparisons of the RNAseq and ChIPseq data for selected genes.

- RNAP occupancy at selected genes (gene names indicated) in wt (blue) and ΔrnjA (red) strains. ymcB UP—5′ untranslated region (UTR) of the ymcB gene. Data represent mean of normalized RNAP coverage from three independent ChIPseq experiments.
- RNA abundance data for genes shown in (A). The genes are grouped into classes (indicated with colored bars with roman numerals) according to trends they displayed between wt and ΔrnjA with respect to gene occupancy and relative expression. Class I: Increased gene occupancy in ΔrnjA is accompanied by increased gene expression; class II: decreased gene occupancy in ΔrnjA is accompanied by decreased gene expression; class III: decreased or equal gene occupancy in ΔrnjA is accompanied by increased gene expression; and class IV: increased gene occupancy in ΔrnjA is accompanied by decreased or equal gene expression. The relative RNA level in wt was set as 1. Data represent mean of normalized read coverage from three independent RNAseq experiments.
Source data are available online for this figure.
