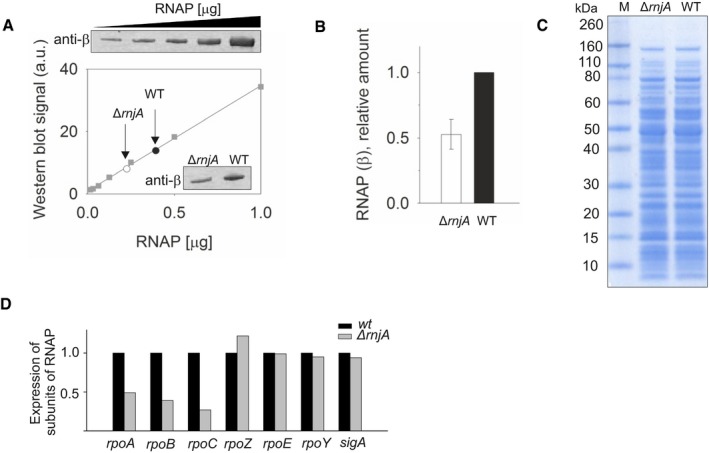
Figure EV4. Amount of RNAP in wt and ∆rnjA strains.

- Determination of the amount of RNAP in wt (black circle) and ΔrnjA (open circle) strains by Western blotting with monoclonal antibody against the β subunit of RNAP. The data for the calibration curve (squares) are shown above the graph; the data for the two strains are in the inset.
- Quantitation of the data shown in (A). The amount of RNAP in wt was set as 1. The experiment was performed three times on three different days. The bars show the average, the error bars ± SD.
- The amounts of cell lysates used to determine relative amounts of β. 5 µg of total protein was loaded per lane.
- Relative mRNA levels of three main RNAP subunits in wt [black bars, set as 1 (LK1371)] and ΔrnjA (gray bars; LK1381) strains. The main RNAP subunits (rpoA, rpoB, rpoC) had lower expression compared to wt. The expression of small subunits (ω, δ and ε) and sigA was unchanged.
Source data are available online for this figure.
