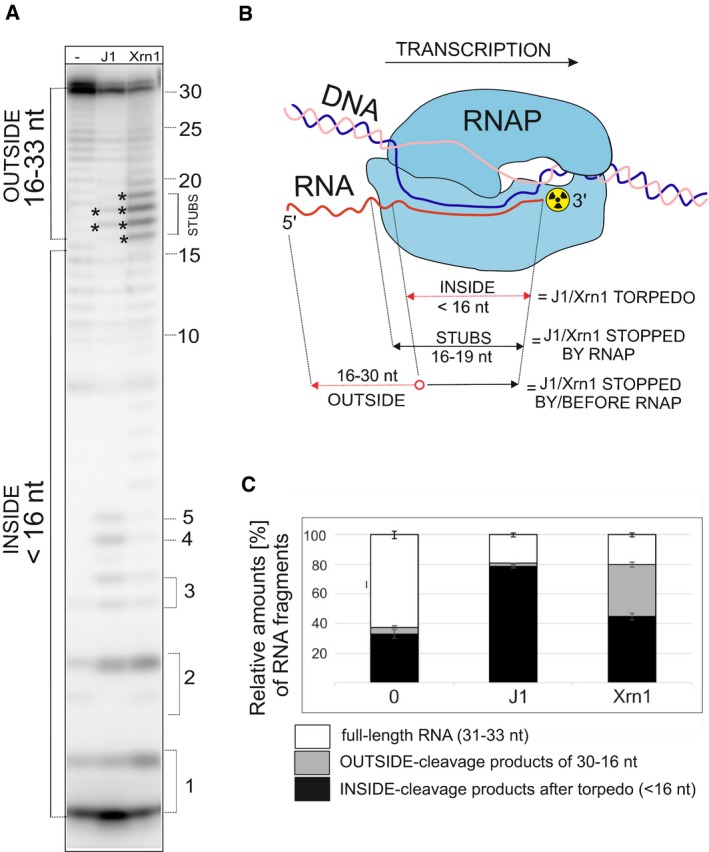
Figure 5. The effect of RNase J1 on TC is RNase‐specific.

- Primary data—polyacrylamide gel—a representative result. The experimental setup was the same as in Fig 4. For the description of bands/fragments, see next panel legend. Asterisks indicate STUBS (16–19 nt).
- A schematic representation of quantitation of fragments. OUTSIDE (16–30 nt) are RNA fragments that originated by digestion of the full‐length RNA by RNases that were stopped either before reaching or at the point of reaching RNAP; STUBS (16–19 nt) are RNA fragments that originated by digestion of the full‐length RNA that were stopped at the point of reaching RNAP; INSIDE (< 16 nt) are RNA fragments (oligonucleotides) that could be only generated after the disassembly of the complex by the torpedo mechanism. The red color indicates parts of RNA that were digested.
- Quantitation of three independent experiments. “Full length“indicates the remaining undigested RNA. “OUTSIDE” and “INSIDE” are fragments as explained in (B) and indicated in (A). The bars represent 100% (all fragments). The black‐gray‐white boxes indicate the percentage of each fragment group (in %). The error bars indicate ± SEM for each group of fragments calculated from three biological replicates.
Source data are available online for this figure.
