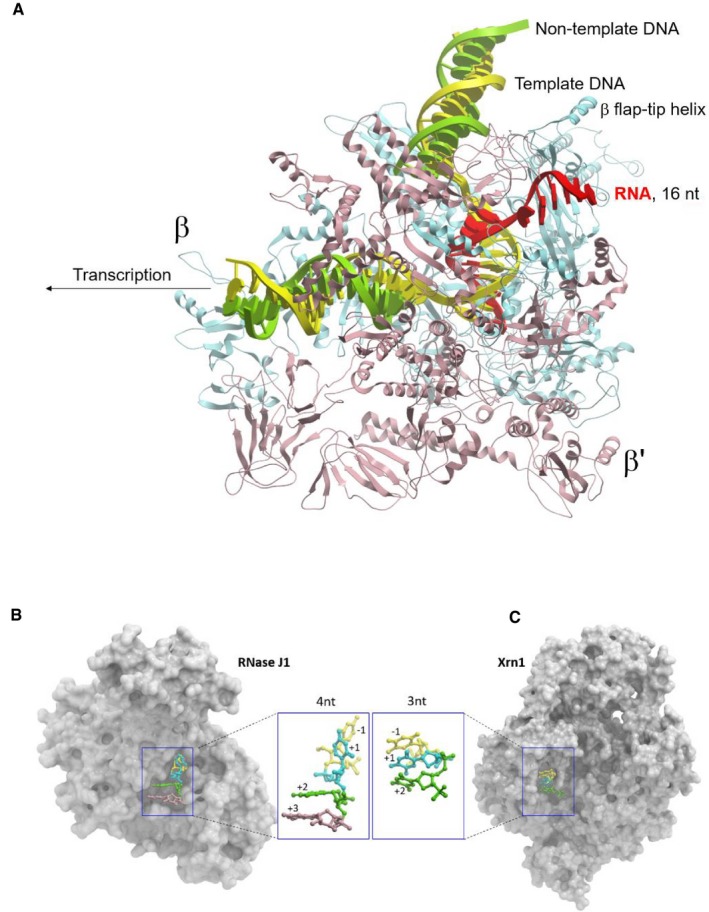
Figure EV5. Paths of RNA in RNAP, RNase J1, and Xrn1.

- Overall view of RNAP‐16nt‐mRNA (PDB id: 6flq). RNAP and bound nucleic acids are shown as cartoon (β—blue, β′—salmon, template DNA—yellow, non‐template DNA—green, mRNA—red).
- Overall view of RNaseJ1‐4nt‐RNA substrate complex (PDB id: 3t3o).
- Overall view of Xrn1‐3nt‐RNA substrate complex (PDB id: 2y35). RNaseJ1/Xrn1 are shown as surface representation. The nucleic acid substrates are shown in ball and stick format. The carbon atoms of individual nucleotides are colored relative to the position of the scissile bond: yellow (−1), cyan (+1), green (+2), and pink (+3).
