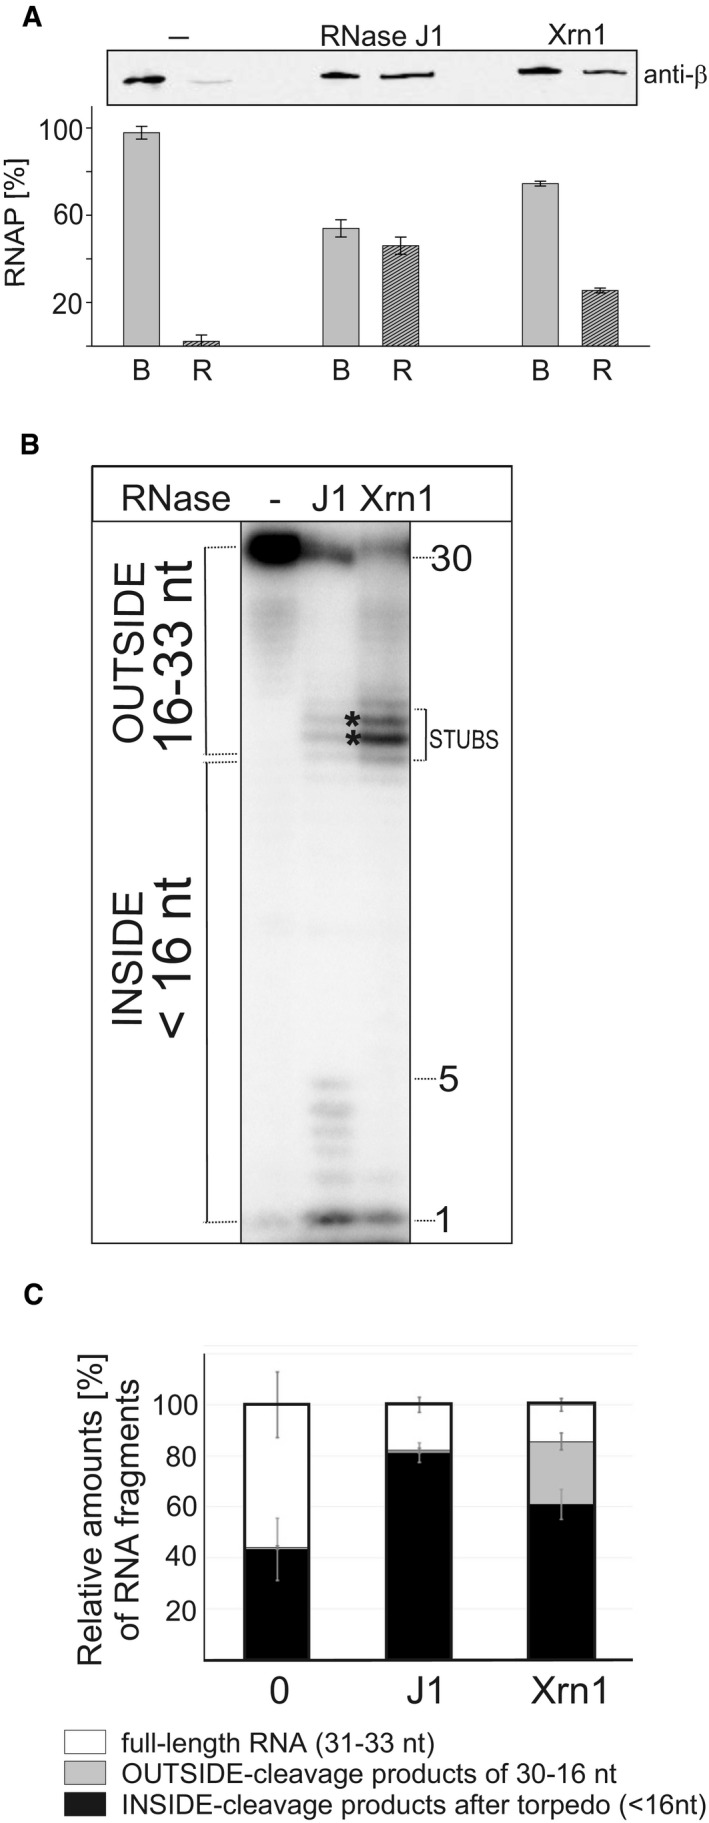
Figure 6. RNase J1 specifically dissociates RNAP from DNA in stalled TCs.

- TCs were assembled on DNA‐RNA scaffolds (DNA was biotinylated and attached to streptavidin‐coated magnetic beads); TCs were then divided into three tubes and challenged with buffer (“−”, mock treatment) or RNase J1 of Xrn1. Dissociation of RNAP from DNA was monitored by detecting RNAP with anti‐β antibody in two fractions: B—beads (RNAP still bound to DNA) and R—released (free in buffer). The gel strip shows representative primary data (Western blot). The graph shows averages (the bars) of two experiments (biological replicates), and the error bars show the range. The combined signal for B+R for each treatment was set as 100%.
- Primary data—polyacrylamide gel. The experimental setup was the same as in Fig 5 but with RNAP from Escherichia coli. Lane 1, the full‐length (33 nt) labeled RNA; lane 2, the same as lane 1 but it included also incubation with RNase J1 (J1); lane 3, the same as lane 1 but included also incubation with Xrn1.
- Quantitation of three independent experiments. “Full length” indicates the remaining undigested RNA. “OUTSIDE” and “INSIDE” are fragments as explained in Fig 5. The bars represent 100% (all fragments). The black‐gray‐white boxes indicate the percentage of each fragment group (in %). The error bars indicate ± SEM for each group of fragments.
Source data are available online for this figure.
