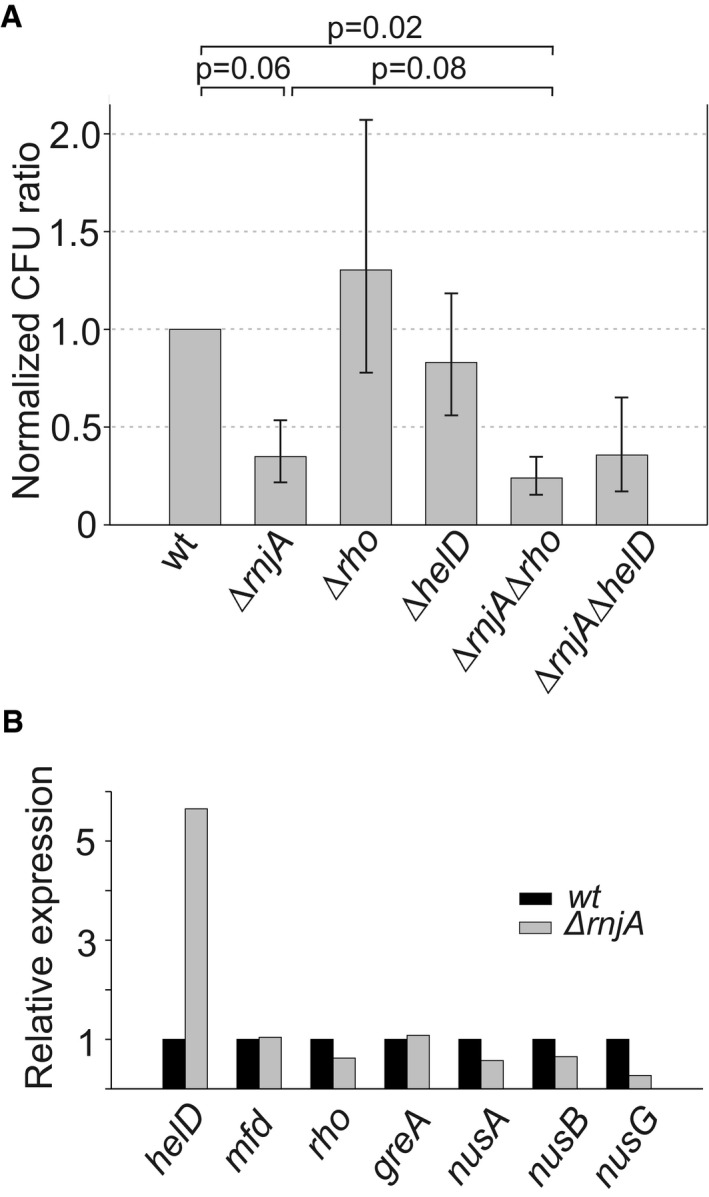
Figure 7. Effect of RNase J1, Rho, and HelD in UV sensitivity assays.

- Exponential cells of indicated strains (below the bars) were plated onto LB agar and either were or were not UV‐irradiated. After overnight incubation, CFU were counted. UV sensitivity of the mutant strains (KO) was then calculated as the ratio between irradiated vs. non‐irradiated cells and normalized to this ratio from the wt strain. As a consequence, the wt ratio is 1. The experiment was conducted 4× (biological replicates), and the bars show the geometric mean. The P‐values, shown above the bars, were computed using two‐tailed unpaired t‐test for logarithms of the ratios. The error bars show ± SEM (computed on the log scale).
- Relative expression (mRNA) of helD, mfd, rho, greA, nusA, nusB, and nusG in the ΔrnjA strain [normalized to wt (set as 1)].
Source data are available online for this figure.
