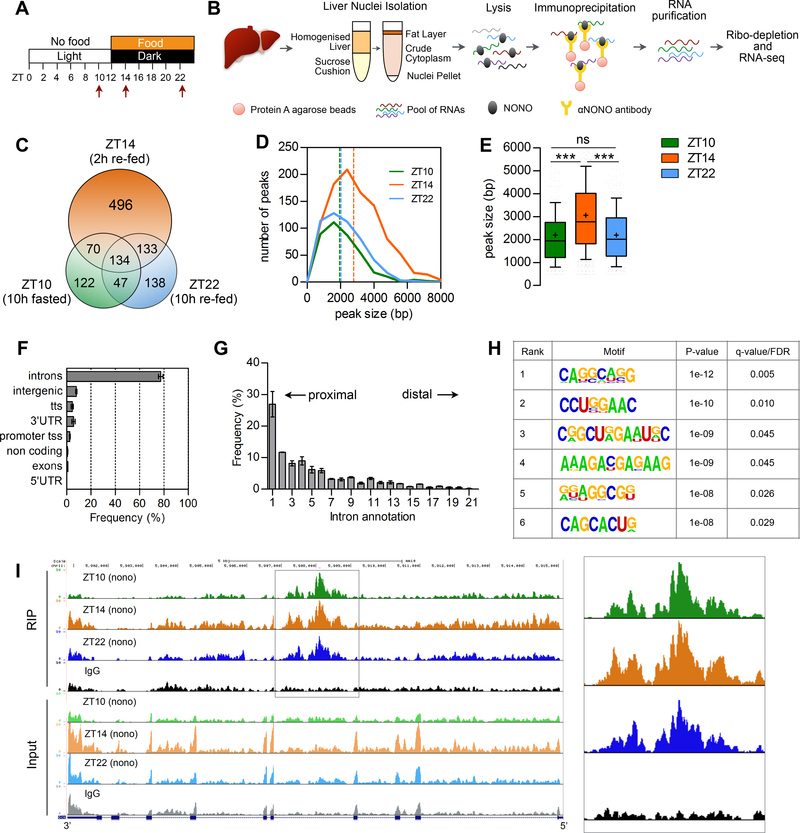
Figure 2. NONO preferentially binds introns and the number of bound transcripts increases upon feeding.
(A) Experimental design indicating the time points at which liver were collected for the RIP-seq (see text for details). (B) Outline of the experimental methods for the NONO RIP-seq in liver nuclei (see also STAR METHODS). (C) Number of genes bound at each time point and overlap among time points. (D) Peak size distribution at each time point, number of peaks = 380 (ZT10), 986 (ZT14), 497 (ZT22). (E) Average peak size for all the peaks identified at each time point. (F) Annotation of the NONO RIP-seq peaks, n=3. (G) Intron position distribution of the RIP-seq peaks, n=3; (H) Significantly enriched RNA motifs among the RIP-seq intron peaks; (I) UCSC genome browser view of the RIP-seq reads mapping to Gck gene, the right panel highlights the NONO RIP-seq peaks in Gck intron 4. Each time point is a pool of 2 independent RIP experiments. In (E) results are represented as box and whiskers: 10–90 percentile range, ‘+’ sign represents mean value. In (F) and (G) results are represented as mean ± SEM. Statistical analysis one-way ANOVA, ***p<0,0001. See also Figure S3 and Table S2.

