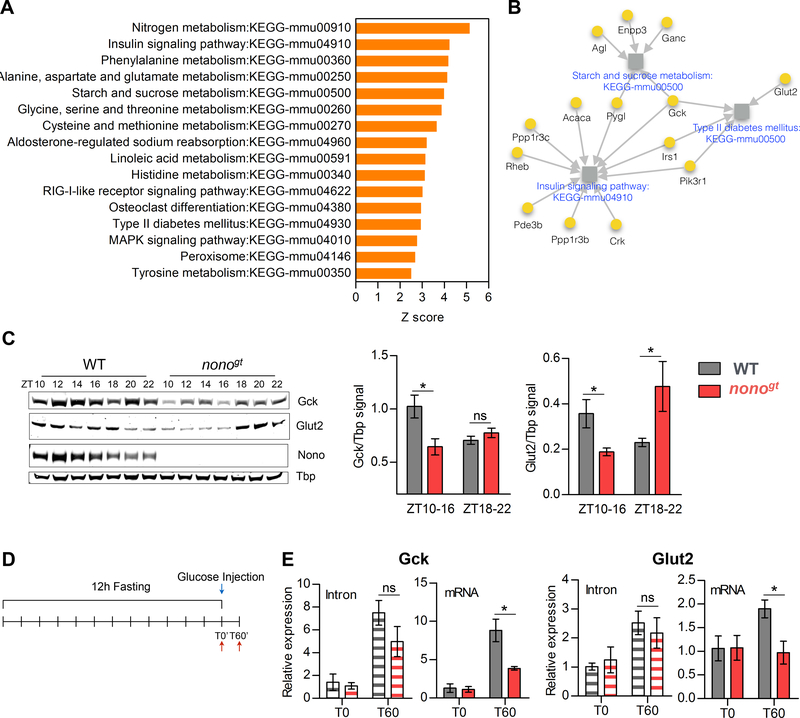
Figure 4. NONO regulates glucose induced gene expression post-transcriptionally.
(A) Enriched KEGG pathways (Z-score >2.5) among the NONO-bound cycling genes. (B) Glucose metabolism related pathways enriched among the NONO-bound cycling genes. Grey squares represent pathways; pathways names are indicated in blue. NONO target genes are represented as yellow circles, for each NONO-target gene the gene name is indicated in black. Grey arrows connect each gene to the pathways it belongs to. (C) GCK and GLUT2 protein expression during the dark/feeding phase and protein quantification (right panels) at the beginning of the dark phase (ZT10–16) and at the end of the dark phase (ZT18–22). ZT10–16 n=4 per group, ZT18–22 n=3 per group. (D) Experimental design for (E), in order to acutely induce Gck and Glut2 expression mice were fasted for 12 hours and injected intraperitoneally with glucose (2g/kg). WT and nonogt liver were collected either at T0 or 60 minutes after glucose injection (T60); (E) qPCR of Gck and Glut2 intron or spliced mRNA levels at T0 and T60, n=3–4 per group per time point. Statistical analysis for (E), two-way ANOVA, Bonferroni posttest. Statistical analysis for (C), student t test. *p<0.05. Results are represented as mean ± SEM. See also Table S5.

