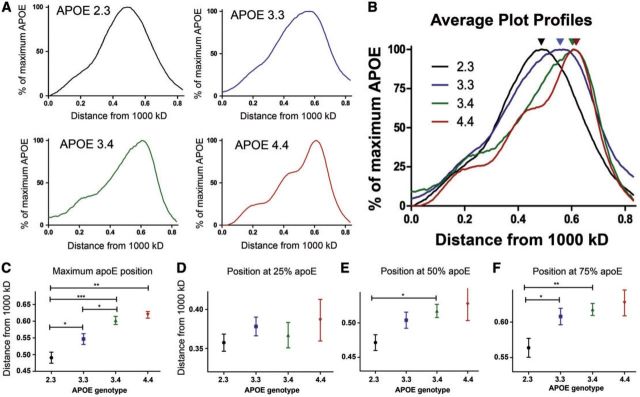
FIGURE 2.
The size of apoE complexes varies by APOE genotype in a middle aged cohort. Sixty-four CSF samples were analyzed and grouped by APOE genotype ( APOE 2.3 , n = 17; APOE 3.3 , n = 21; APOE 3.4 , n = 21; APOE 4.4 , n = 5). The positions at maximum, 25%, 50%, and 75% apoE were found from the plot profile of each sample. (A) The normalized plot profile of each sample was averaged by genotype. (B) An overlaid image of the average plot profiles for each APOE genotype. Arrows indicate the position of maximum apoE. (C–F) The x values for the point at (C) maximum apoE, (D) 25% apoE, (E) 50% apoE, and (F) 75% apoE were averaged and analyzed using a one-way ANOVA (*p < 0.05, **p < 0.01, ***p < 0.001).

