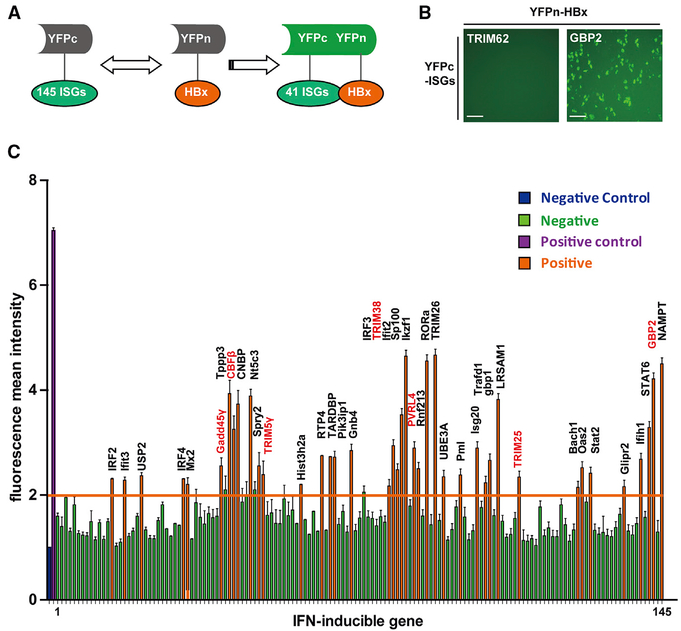
Figure 1. Screening of ISGs That Interact with HBx by BiFC Assay.
(A) Schematic illustration of the BiFC assay. (B) Expression plasmids for YFPc-GBP2 and YFPc-TRIM62 were transfected individually with YFPn-HBx plasmid into 293T cells. YFP fluorescence intensity was measured 36 h post-transfection. Scale bars represent 100 μm. (C) A total of 145 YFPc-ISG plasmids were transfected individually with the YFPn-HBx plasmid into 293T cells, and YFP fluorescence was measured after 36 h by flow cytometry. YFP fluorescence mean intensity (MFI) of >2 was deemed to signify interaction with HBx (labeled in orange) and <2 was deemed to indicate absence of any interaction (labeled in green). The positive control (YFPc-58CUN+YFPn-FNCC) is marked in purple, and the negative control (YFPc-58CUN or YFPn-FNCC was transfected individually; MFI, 1) is in blue. Mean ± SD values from three independent experiments are shown.

