-
A
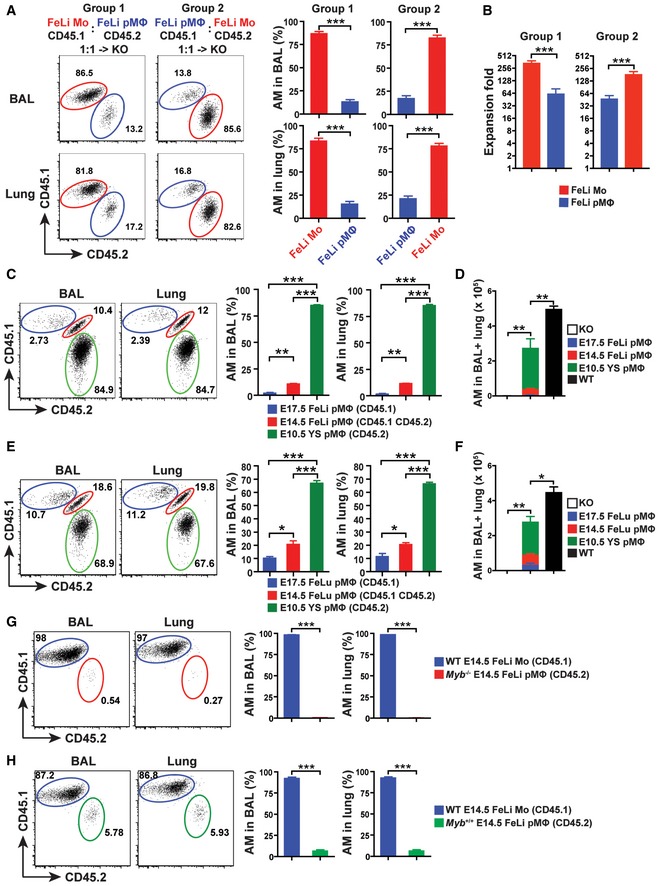
Representative flow cytometric analysis (left) and percentage of donor‐derived AM (right) in the BAL (top) and lung (bottom) from Csf2ra
−/− recipients 10 weeks after neonatal transfer of 1:1 mixture with CD45.1+ E14.5 FeLi Mo and CD45.2+ E14.5 FeLi pMΦ (Group 1) or CD45.1+ E14.5 FeLi pMΦ and CD45.2+ FeLi Mo (Group 2) (n = 3 mice).
-
B
The expansion fold of donor cells in Csf2ra
−/− recipients 10 weeks after neonatal transfer of cells described above in (A) (n = 3 mice).
-
C
Representative flow cytometric analysis (left) and percentage of donor‐derived AM (right) of BAL and lung from Csf2ra
−/− recipients 8 weeks after neonatal transfer of 1:1:1 mixture with CD45.1+ E17.5 FeLi pMΦ, CD45.1+CD45.2+ E14.5 FeLi pMΦ, and CD45.2+ E10.5 YS pMΦ (n = 3 mice).
-
D
Total numbers of donor‐derived AM in the BAL and lung of adult Csf2ra
−/− recipients 8 weeks after transfer of cells described above in (C) (n = 3 mice). Age‐matched Csf2ra
−/− (KO) (n = 3 mice) and WT (n = 3 mice) were included as negative and positive controls.
-
E
Representative flow cytometric analysis (left) and percentage of donor‐derived AM (right) of BAL and lung from Csf2ra
−/− recipients 8 weeks after neonatal transfer of 1:1:1 mixture with CD45.1+ E17.5 FeLu pMΦ, CD45.1+CD45.2+ E14.5 FeLu pMΦ, and CD45.2+ E10.5 YS pMΦ (n = 3 mice).
-
F
Total numbers of donor‐derived AM in the BAL and lung of adult Csf2ra
−/− recipients 8 weeks after transfer of cells described above in (E) (n = 3 mice). Age‐matched Csf2ra
−/− (KO) (n = 3 mice) and WT (n = 3 mice) were included as negative and positive controls.
-
G, H
Representative flow cytometric analysis (left) and percentage of donor‐derived AM (right) in the BAL and lung from Csf2ra
−/− recipients 7 weeks after neonatal transfer of 1:1 mixture with CD45.1+ E14.5 FeLi Mo from WT embryos and CD45.2+ E14.5 FeLi pMΦ from Myb
−/− (G) or Myb
+/+ (H) embryos (n = 3 mice).
Data information: In (A, B), the data are representative of three independent experiments. In (C–H), the data are representative of two experiments. Data are presented as mean ± SEM, Student's
t‐test (unpaired) was used: ns, not significant; *
P <
0.05, **
P <
0.01, ***
P <
0.001.

